

- The PlayDapp Coin price has surged by over 35% in a month.
- It has formed a descending triangle pattern on the daily chart.
- The current market price of the PlayDapp Coin is $0.2161.
Since the PlayDapp coin was listed on the Binance Exchange, it has shown a massive decline from the upper levels. The coin price created an all-time high (ATH) level of $3.68 level on October 2021 and created an all-time low level of $0.09696 on 22 June 2021.
The PLA Coin price has shown a massive decline of over 92% from the high and has formed a lower high and lower low pattern on the daily chart. It has been confirmed that the coin price has been in a downtrend and has created a bearish chart structure.


The Coin price halted the selling at the beginning of 2023 and the coin price has shown a great surge from there. However, this surge didn’t last longer and the bears have entered again in the coin at higher levels.
After that, the coin price started to consolidate in a broader range of $0.2900 and $0.1290 and it is still trading inside this range. The current market price (CMP) of the coin is $0.2161 and is trading in the middle of the range.
Will The PLA Coin Price Continue To Surge Towards The $0.3000 Level?
In the current trading session, the coin price is trading with a slight surge of $0.0007 or 0.32%. The traded volume for the coin at the time of writing this article is 2.983 Million, which is much less than the 10-day average traded volume.
The PlayDapp Coin has formed a downward-sloping trendline which can act as resistance to the price. This trendline is currently present near the level of $0.2274.
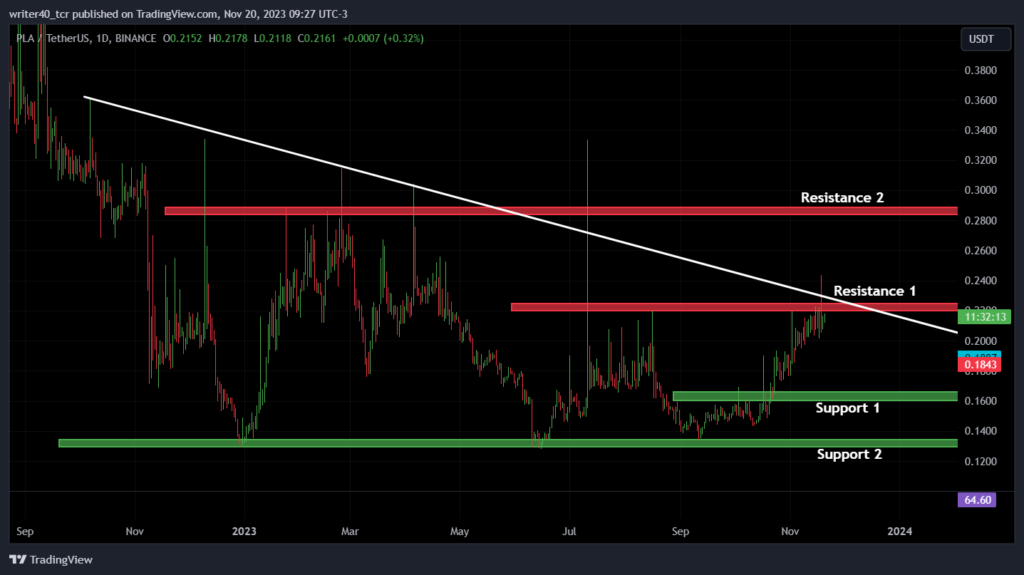
Apart from the trendline, the resistance level for the coin is present near the level of $0.2232. If the price breaks this resistance, it can head towards the other resistance, which is present near $0.2900.
The coin price has breached the crucial resistance level of $0.1658 in this surge and this level will now act as a support to the price. Apart from this, the other support is present near the level of $0.1290.
What are the Indicators Indicating About the PLA Coin?
The coin price is trading above both the 50-day and 200-day exponential moving average (EMA). It has recently shown a golden crossover on the daily chart, which is a bullish sign.
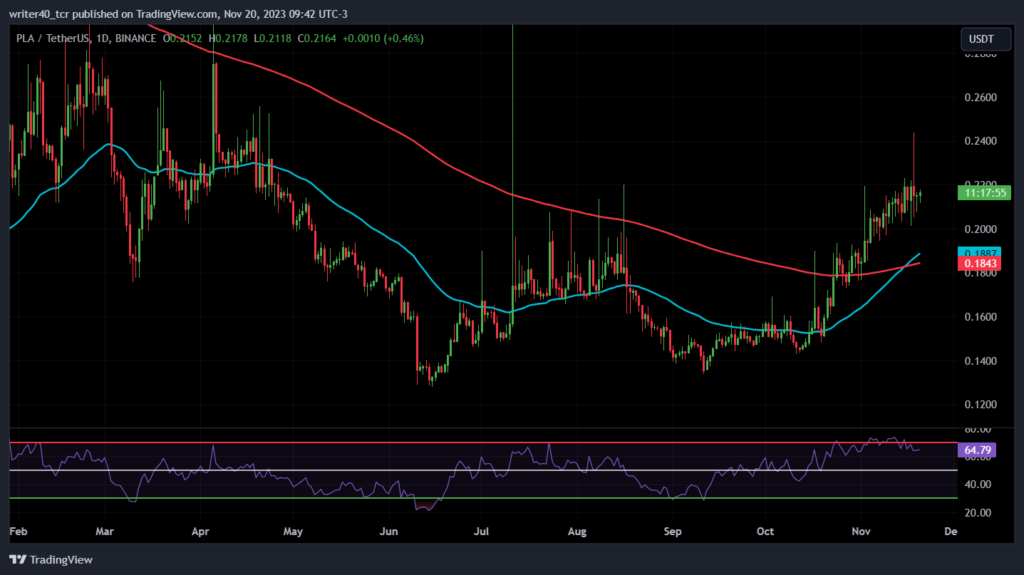
The relative strength index (RSI) is curving at 64.73 and has shown an overbought trajectory. Currently, the slope of the RSI is bending down which indicates that the bulls are losing momentum.
Conclusion
The PLA coin price is on the verge of giving a breakout of the descending triangle pattern. It can show some wild swings on the upper side if it breaks the resistance level and the pattern comfortably.
Technical level
- Resistance level – $0.2232 and $0.2900
- Support level – $0.1658 and $0.1290
Disclaimer
The views and opinions stated by the author, or any people named in this article, are for informational purposes only. They do not establish financial, investment, or other advice. Investing in or trading crypto assets comes with a risk of financial loss.


