

- The maximum supply of EGLD is $31.4 Million.
- EGLD coin has been showing a rise of 48.7% in the last month.
MultiversX is a blockchain crafted to facilitate scalability and the development of secure decentralized applications.
It utilizes adaptive state sharding, secure Proof-of-Stake, and a specialized virtual machine, enabling developers to create applications in various languages such as Rust, C/C++, C#, and Typescript.
Financial Data of the EGLD Coin
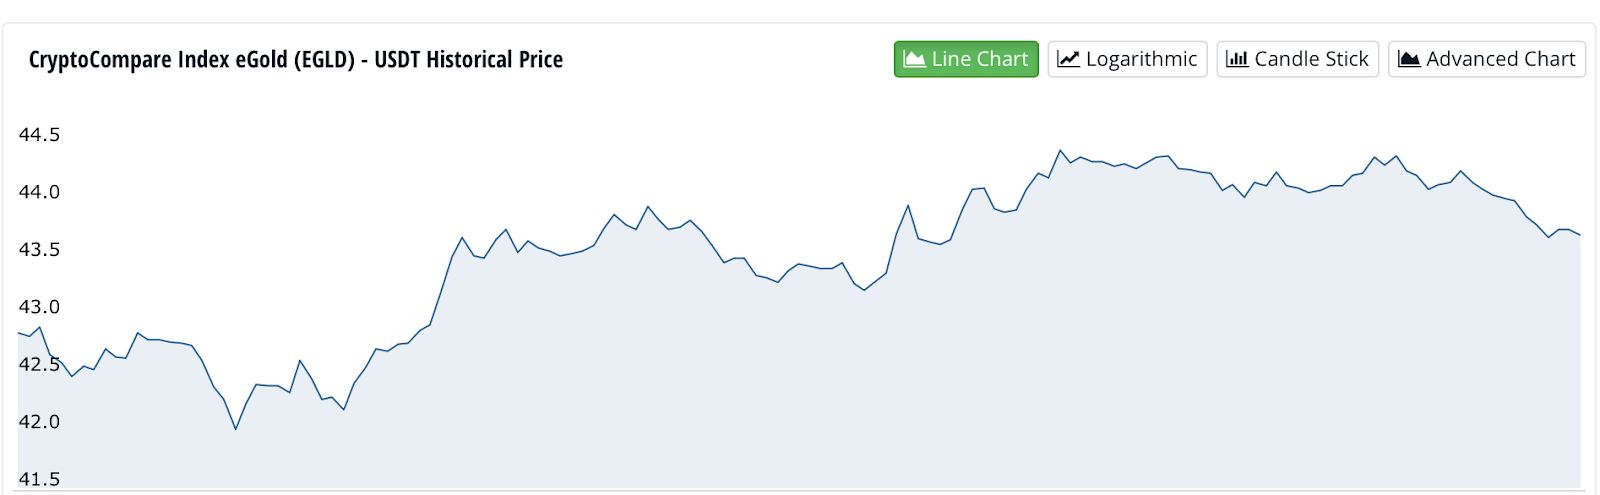
The EGLD coin is presently trading at $43.7, marking a 24-hour increase of $0.2728. However, the coin’s volume declined by 33% in today’s market session, suggesting profit booking by investors.
The coin has demonstrated a 48% return in the past month, resulting in a market cap of $1.1 Billion and a volume/market cap ratio of 0.03.
The EGLD coin has a maximum supply of $31.4 Million whereas the total circulating supply is $26.2 Million. The market cap dominance of the coin is 0.078%.The 52-week high of the coin is $54.16 and the low is $22.30.
MultiversX (EGLD) Technical Analysis
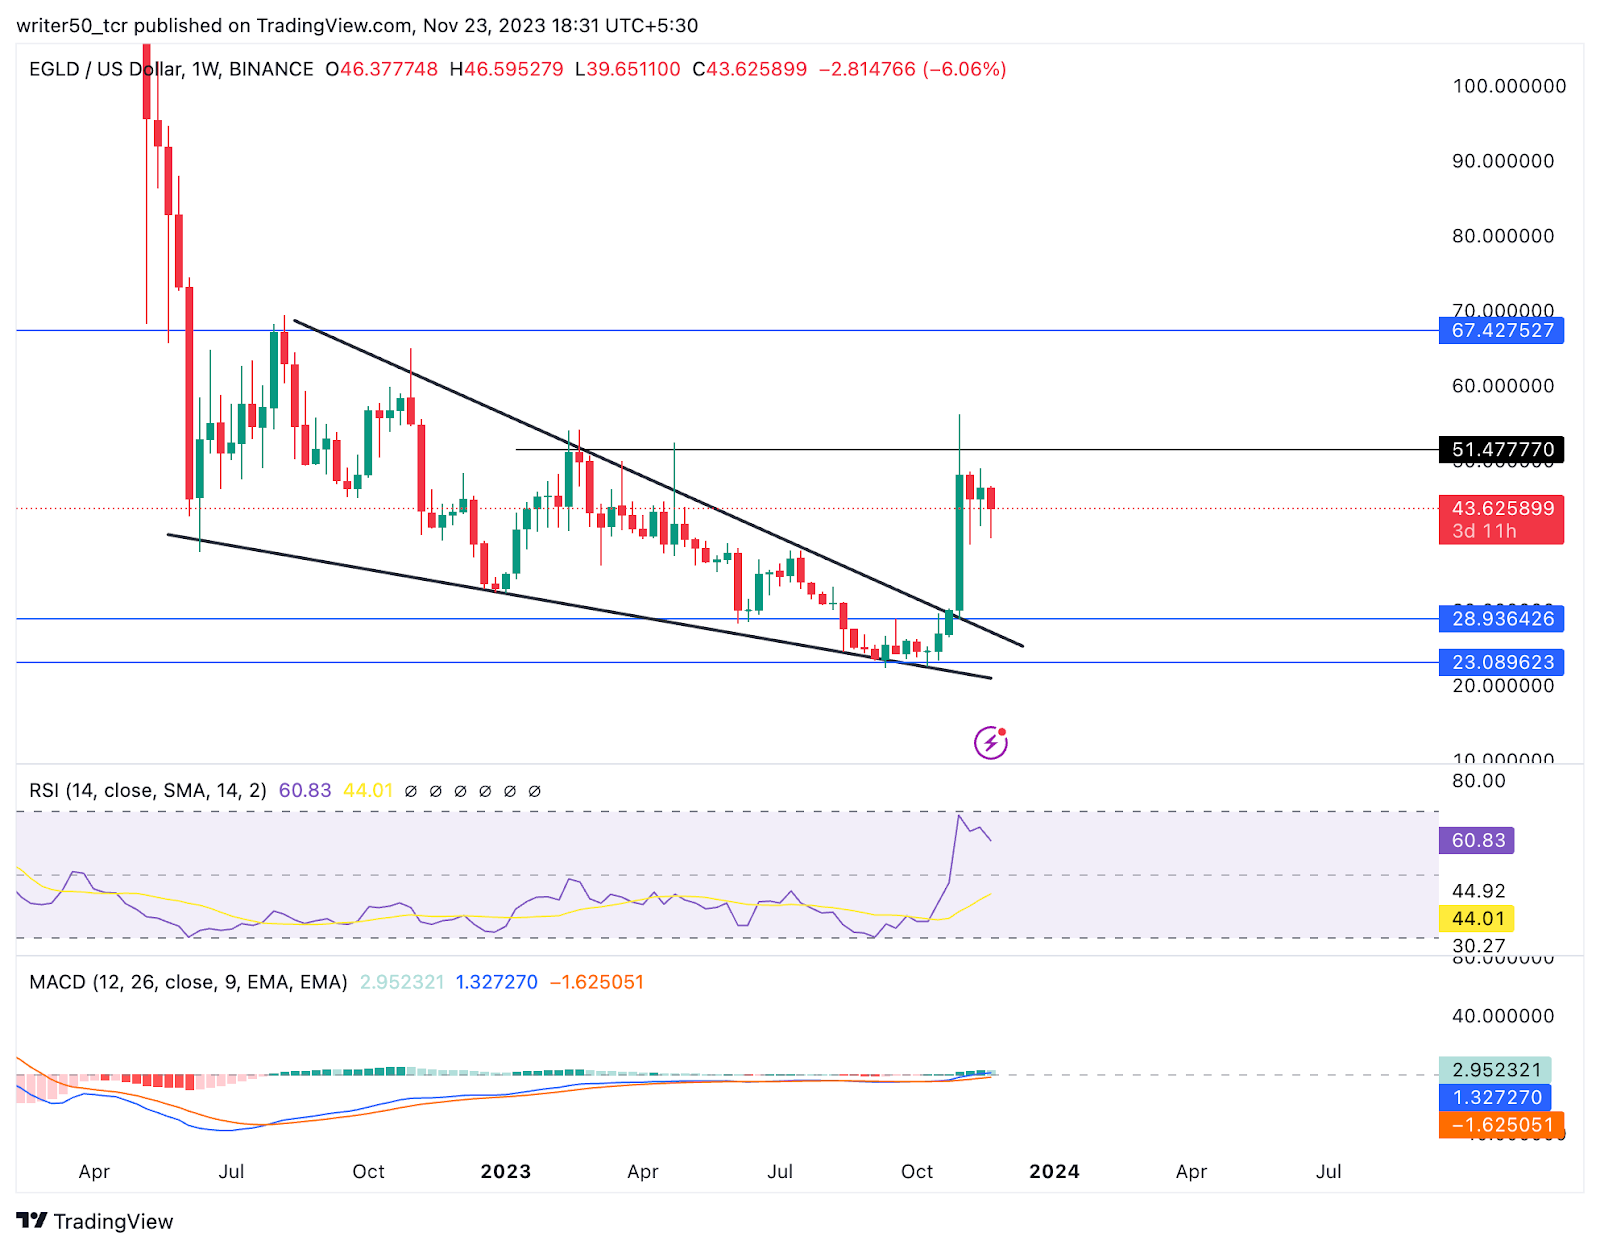
After reaching an all-time high of $560.51 in November 2021, the coin experienced a substantial decline of over 90%. Nevertheless, the price found support at the swing low of $23.08, leading to a remarkable recovery of over 120% and a breakout from the triangle pattern.
Currently, on the weekly timeframe, the EGLD coin is encountering resistance at the $51.4 level, resulting in the formation of a few red candles, suggesting a retracement after a period of steady performance.
The overall factors indicate a favorable environment for a positive move. However, confirmation of a price uptrend will require the price to break above the immediate resistance level.
Technical Indicators Overview of EGLD
The MACD line of EGLD coin is located above the signal line, portraying a positive pattern and suggesting a potential future price rise.
The RSI line for EGLD is trading at 60 level and it is above the SMA line. This arrangement is considered a positive pattern.
Conclusion
The EGLD coin has shown a positive return in the previous month and the indicators are giving a bullish sentiment. The price has shown a good recovery and currently facing resistance at the $51.4 level. If the price breaks above this level, a further shift in trend can be observed.


Technical Levels
- Support Levels: $28.9 and $23.08
- Resistance Levels: $51.4 and $67.42
Disclaimer
The views and opinions of the author, or anyone named in this article, are for informational purposes only. They do not offer financial, investment, or other advice. Investing or trading crypto assets involves the risk of financial loss.


