

- The number of total holders is witnessing an advance as per Etherscan.
- The BEAM crypto is trading at a level of $0.008382 while facing a decline of 1.63% in the last 24 hours.
Beam, launched in 2018, is a privacy-centric cryptocurrency that prioritizes confidentiality without sacrificing usability. Its default private transactions and open-source development distinguish it. Created by a skilled team, Beam is used for deflationary purposes, featuring advanced features like Atomic Swaps, Confidential Assets, and a Dapp store.
The BEAM crypto has a market cap rank of #125 as per Coingecko and has a market cap dominance of 0.026%. Also, the volume/market cap ratio of BEAM crypto is 0.0661. The traded volume for the BEAM crypto in the last 24 hours is $25.761M.


The market cap of the BEAM crypto has declined by 1.84% in the last 24 hours, resulting in $351.555M. The max supply of the crypto is not defined and the circulating supply of the crypto is 41.942B BEAM. The fully diluted market cap of the crypto is $526.526M.
BEAM Derivatives Analysis

The long liquidation of the crypto is very high compared to the short liquidation. This has further resulted in a long/short ratio of 0.922. The derivative trading volume of the crypto is trading flat showing an advance of 8.65%. The following derivative data represents the dominance of sellers.
BEAM Crypto Technical Analysis

On the weekly charts, the BEAM crypto is making lower low swing patterns. The price is following a strong downtrend and has declined to significant lows of $0.041662. This behavior of the price represents that the sellers have dominated the major trend.
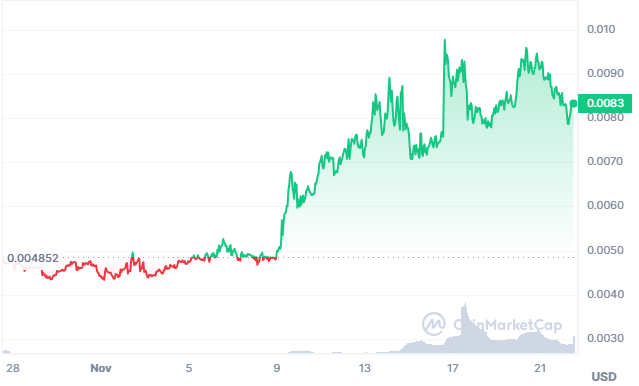
BEAM/USD Chart by TradingView
On the daily charts, the crypto price has advanced by more than 50% from the recent lows. It is currently retracing and trading above the consolidation zone.
The price also had broken above the Bollinger bands, which represents that the price might retrace to the baseline. Further, the market is following a bullish trend on the charts as it is trading above the baseline of the Bollinger band.
The MACD is also giving a buy signal on the charts with a gain in momentum. The MACD line is trading above the signal line representing the presence of buyers in the market.
Conclusion
BEAM, ranked #125 with a market cap of $351.555M, holds 0.026% dominance. A recent decline of 1.84% led to $25.761M in 24-hour trading volume. Derivatives indicate seller dominance, with a high long liquidation. Technical analysis shows a bearish trend, but the recent 50%+ retracement introduces uncertainty to the price direction.
Technical Levels
- Support levels– $0.02490 and $0.039920
- Resistance levels– $0.45860 and $0.92500
Disclaimer
The views and opinions stated by the author or any other person named in this article, are for informational purposes only and do not constitute financial, investment, or other advice. Investing in or trading crypto or stocks comes with a risk of financial loss.


