

- The FTT crypto is trading 503% above its all-time lows.
- In just one last trading session the crypto price has advanced by 21.4%.

FTX was a crypto derivatives exchange that offered various trading products and services. It was created by Alameda Research, a crypto market maker, and used the FTT coin as its native token. However, FTX collapsed in November 2022 after a report exposed its financial vulnerability and leverage.
Binance attempted to buy FTX but backed out due to legal issues. FTX filed for bankruptcy, affecting many investors and partners, such as BlockFi. It is now under investigation for possible fraud and misconduct.


Price Data of the FTX Token
As per CoinMarketCap, the market cap of the FTT crypto is $1.517B resulting in a market cap rank of #41. The volume/market cap ratio of the crypto is 23.88 followed by the last 24 hours.
Following this, the market cap of the crypto has advanced by 19.96% in the last 24 hours. Also, the spot trading volume for the FTT crypto has advanced by 26.99% resulting in $356.751M. This phenomenon has resulted in a ranking of 21st for the trading volume in the Coinmarketcap.
Token Contract Overview

The token transfer amount has highly declined in recent times from the high of 357.013M FTX tokens to a recent transfer of 4.737M FTX tokens. It is followed by a most recent transfer count of 1388 and has 544 unique receivers.
FTT Crypto Technical Analysis
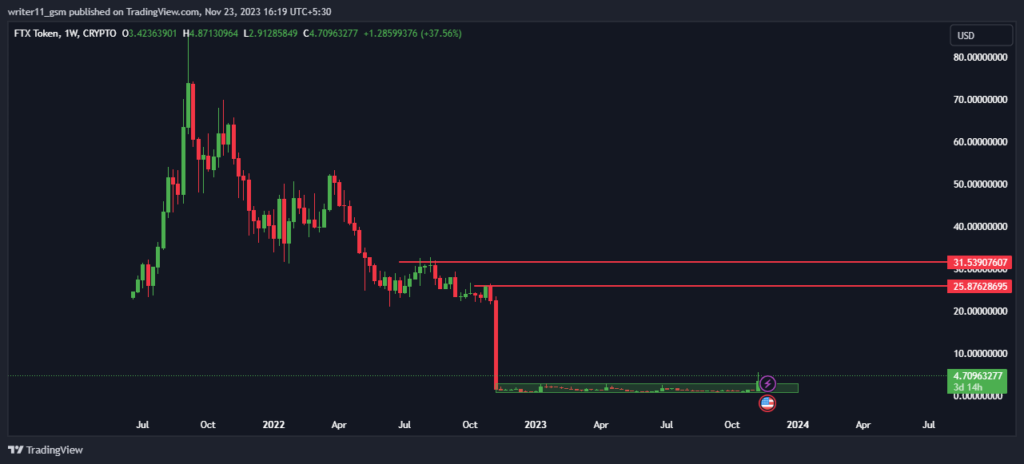
After losing its value by more than 90%, the FTT crypto price consolidated inside the zone for a very long time. Further, the price resulted in a breakout towards the higher level. It indicates that the buyers won the battle after the accumulation stage.
FTX/USD Live Chart by TradingView
After breaking above the consolidation, the FTX crypto is again advancing after taking support at the breakout level. It shows that the breakout is sustainable and the price might continue to advance.
The Price of the FTX crypto is following an uptrend trading above the crucial EMAs. The 50-day and the 200-day EMAs have given a fresh golden cross. It shows that the new bullish trend is beginning in the longer term.
The DMI is indicating bullish as the +DI is trading at a level of 56.93, higher than the -DI. The ADX is also trading above the 20 level, which indicates strength in the trend.
Conclusion
The FTX token is showing bullish signs, as it has broken out of a consolidation zone and is trading above the 50-day and 200-day EMAs. The paragraph also uses a chart and some indicators to support its analysis. The paragraph concludes that the FTX token is following an uptrend and has a strong trend strength.
Technical Levels
- Support levels– $0.9030 and $2.780
- Resistance levels– $25.860 and $31.530
Disclaimer
The views and opinions stated by the author or any other person named in this article, are for informational purposes only and do not constitute financial, investment, or other advice. Investing in or trading crypto or stocks comes with a risk of financial loss.


