

- The Wanchain Coin price has given a breakout of the Descending triangle pattern on the daily chart.
- The WAN Coin price has surged by over 13% in a month.
- The current market price of the Wanchain coin is $0.2044.
In the initial phase of trading, the WAN coin price has shown a significant surge on the upside. It has shown a great surge of over 3600% from the lower level, which is a remarkable return for the investor.
After the decline, the coin price started to rise at the beginning of 2021. It has surged significantly from the lower level and gave an amazing return to the investors. The price has surged by over 1100% in that surge.


The Wanchain coin price reached an all-time high of $9.92 on May 4, 2018, and from there it started declining. In this decline, the coin price has attained its all-time low level of $0.07575.
‘The Coin price is trading around the lowest level of its trading journey. Currently, it has been trading in a sideways trend since May 2022. It has shown a good surge in this period multiple times but has failed to sustain at higher levels.
Can The Wanchain Coin Price Reach the $0.5000 level in 2024?
The WAN coin price has formed a descending triangle pattern on the daily chart. It has recently given a breakout of the pattern and is not able to generate the necessary buying pressure to push the price up sharply.
The Coin price is trading above the breakout level which confirms that the breakout was genuine. However, it seems like the bears are strongly present at a higher level and are redistricting the price to go up.

After the breakout, the WAN coin price has shown good strength and it has breached the important resistance area of $0.2316. However, the price didn’t sustain above that level and closed below that on the same trading day.
The price is looking strong in the favour of bulls, as it has formed a big bullish candle in the previous trading session. If the coin price is able to break the resistance level of $0.2316, then it can move towards the level of $0.2633.
If the price reverses from this level and starts to decline, then it can try to test the strength of buyers present near the level of $0.1640 and If it breaks this support level, then it can achieve the target of $0.1323.
What Do Bollinger Bands and Relative Strength Index Indicate About the Coin?
The Coin price is trading below the median line of the Bollinger Bands which indicates that the coin price is Bearish. Initially, it closed below the lower band, but on the next day, it came back inside the band.
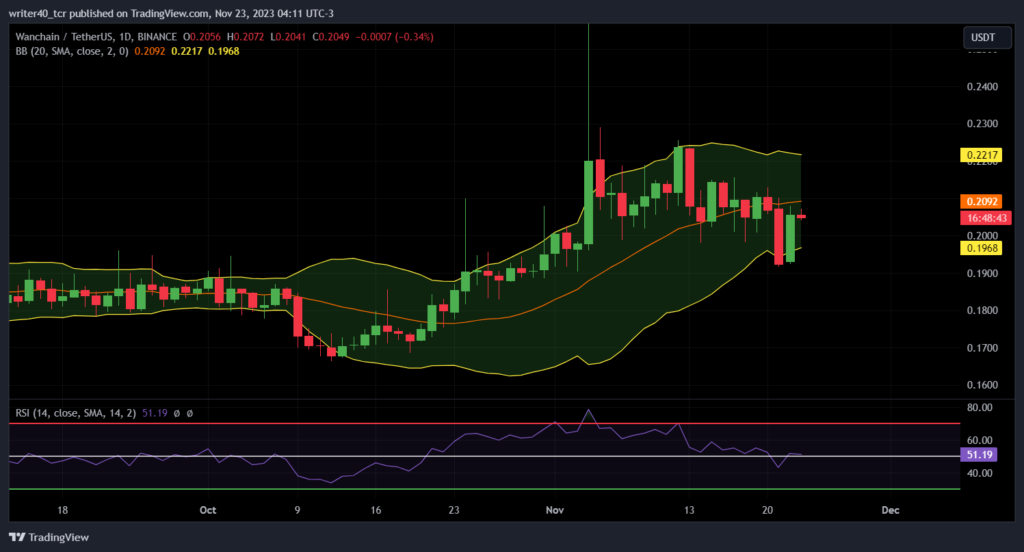
The relative strength index is curving at 51.19, which indicates that both the buyers and sellers are enjoying almost equal momentum on their side. The slope of the RSI is downwards which shows that the bears are getting stronger.
Conclusion
The WAN coin price has given a breakout of a descending triangle pattern and is trading above the breakout level which is a bullish sign. However, the RSI is sloping downwards which is a good sign for the bears.
Technical level
Resistance level – $0.2316 and $0.2633
Support level – $0.1640 and $0.1323
Disclaimer
The views and opinions stated by the author, or any people named in this article, are for informational purposes only. They do not establish financial, investment, or other advice. Investing in or trading crypto assets comes with a risk of financial loss.


