

- The GRT crypto price is trading 95% below its all-time high.
- The Graph crypto price is trading with flat volumes followed by the last 24 hours.

The Graph (GRT) is a protocol that enables developers to access data from various blockchains for building decentralized applications (dApps). It indexes and queries blockchain data, making it easier to create dApps that are more reliable, efficient, and scalable.
The Graph was launched in 2018 by a team of developers led by Yaniv Tal and Jannis Pohlmann. GRT is also a governance token for The Graph ecosystem, allowing holders to participate in decision-making and earn rewards for staking.


The GRT crypto has witnessed a decline of 5.26% in the spot trading volume, following an advance of 1.33% in the market cap. It has resulted in a market cap value of $1.302B and a ranking of 48th as per CoinMarketCap.
The circulating supply of the crypto is 9.313B GRT. Following this, the current max supply of the GRT crypto is 10.785B GRT coins. The resulting fully diluted market cap of the crypto is $1.513B.
GRT Crypto Technical Analysis
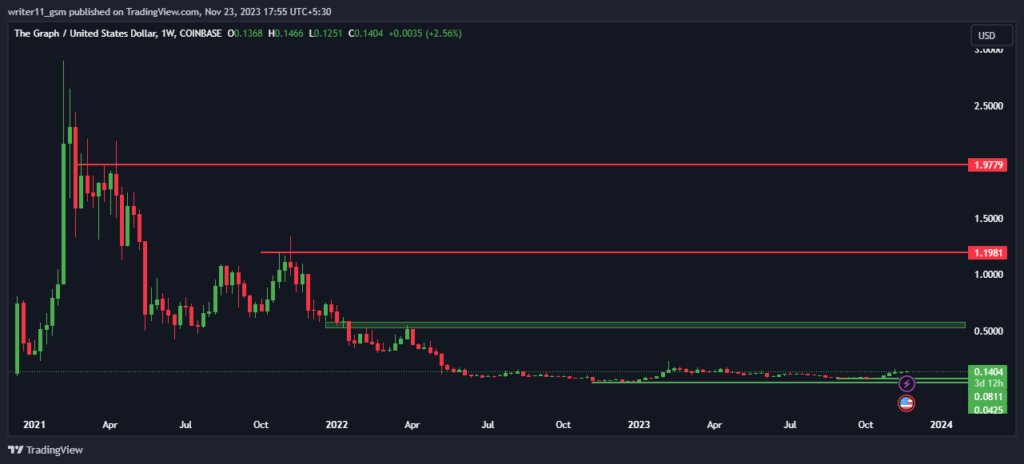
The price of the GRT token has been facing a consistent decline throughout time, leading to a strong downtrend. The price has lost its value by more than 95%, which means that the price is trading at bottom levels.
The GRT crypto has a change of character level at $.5600. It means if the price breaks above that level, it can lead to further highs.
GRT/USD Live Chart by TradingView
The GRT crypto price also has broken out above the triangle pattern and is making higher high patterns. It shows that the buyers are gaining dominance over the price.
The GRT token price is trading above the 50-day and the 200-day EMAs. This behavior of the price represents bullishness on the charts.
The DMI indicator is also giving a bullish signal on the charts. Following the same, the ADX is also showing strength on the charts. It is currently trading at a level of 35.67.
Conclusion
The GRT crypto is showing strong signs of recovery after a long downtrend. It has broken out of a triangle pattern and is making higher highs. It is trading above the 50-day and 200-day EMAs, indicating bullish momentum. The DMI and ADX indicators are also confirming the strength of the uptrend.
Technical Levels
- Support levels- $0.0425 and $0.0810
- Resistance levels- $0.2307 and $0.4100
Disclaimer
The views and opinions stated by the author or any other person named in this article, are for informational purposes only and do not constitute financial, investment, or other advice. Investing in or trading crypto or stocks comes with a risk of financial loss.


