

- Band Protocol price has been falling towards support and forming a pattern similar to a descending triangle.
- The BAND price has fallen by 7.09% over the past seven days.
Current Price – $1.391 (-3.40%) Sentiment – Bearish
Max Supply – 100.0 Million Fear & Greed Index – 66 (Greed)


Volatility – 3.67% (Medium) Green Days – 16/30 (53%)
RSI – 45 200–Day EMA – $1.348
Trading Volume (24h) -$7.7 Million All-time high – $23.19
Based on recent data, BAND holds a market capitalization of $189.6 Million, while the circulating supply is 136.4 Million BAND.
What is Band Protocol?
Band Protocol connects real-world data and APIs to smart contracts. Band Protocol is a cross-chain data oracle platform based on blockchains to access data by APIs.
Soravis Srinawakoon, Paul Chonpimai, and Sorawit Suriyakarn confounded the Band Protocol in 2017.
BAND Price Prediction For 2024, 2025, 2026, 2027, 2028, 2029, and 2030
| Year | Year Low | Year High |
| 2024 | $1.385333 | $4.73 |
| 2025 | $1.567121 | $2.90 |
| 2026 | $1.150021 | $1.933634 |
| 2027 | $1.144488 | $1.369836 |
| 2028 | $1.471835 | $10.27 |
| 2029 | $1.655629 | $5.34 |
| 2030 | $0.505539 | $2.67 |
All the prediction data is based on the price performance algorithm of the BAND.
BAND Price Prediction 2025

Over the weekly chart, the buyers are struggling to make an upward move in the market. Buying pressure is absorbed near the 50-day EMA, suggesting the price could fall in the short term. As per the analysis, the maximum value that the BAND could hit by 2025 is $2.90 and the minimum value for 2025 is $1.567121. These predictions can be changed as per the BAND’s future price action.
BAND Price Prediction 2030

Over the monthly timeframe, the BAND price has been moving whitening a close range and indicating the low trading volume. However, bullishness has been observed during the past two months while the sellers are dominating during the present month.
If BAND manages to attract new buyers, the price could jump to upper levels in the future. As per the price algorithm and previous price data, the BAND price might reach up to $2.67 by 2030 and the minimum predicted price is $0.505539.
Technical Outlook Of BAND Over Daily Timeframe
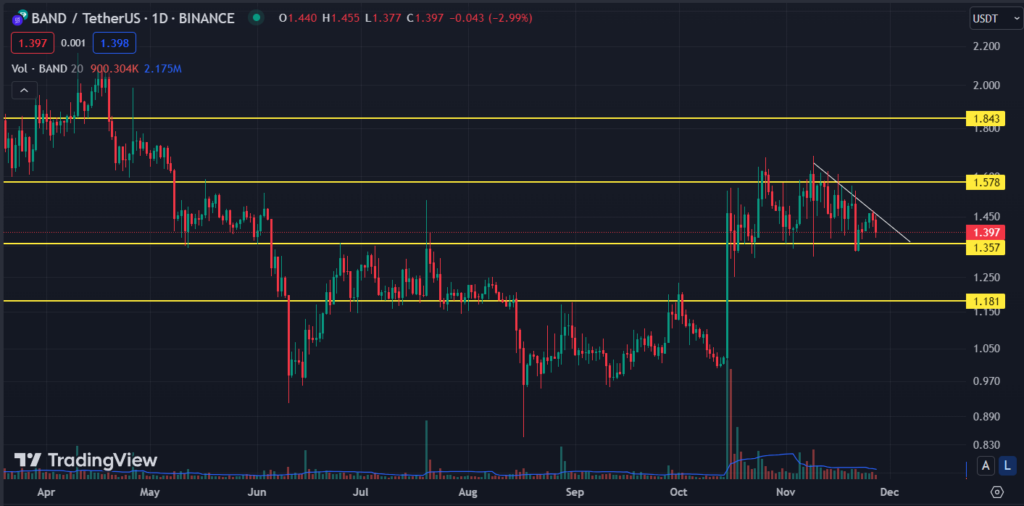
BAND has been moving in consolidation during September and October. A strong price pump of almost 43.38% was observed during the 15th of October. Recently, the BAND again entered consolidation and traded between $1.5 and $1.3 as resistance and support respectively. The Band Protocol price has been falling towards support and forming a pattern similar to a descending triangle.
The BAND registered an intraday trading volume of $7.7 Million with an increase of approximately 15.32% in Monday’s session. The slight increase in trading volume suggests that new traders are entering the market.
BAND price is trading at $1.391, with an intraday loss of 3.40%, highlighting bearishness over the chart. Additionally, the BAND price has fallen by 7.09% over the past seven days.
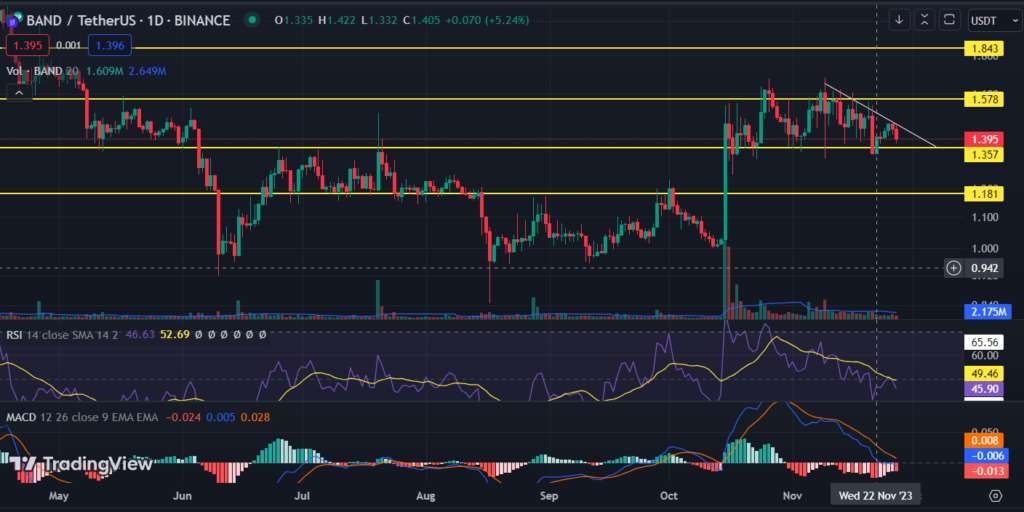
Testimony of Technical Indicators
| Indicator(Oscillators/Moving Averages) | Value | Prediction |
| Relative Strength Index | 45.70 | Neutral |
| Chaikin Money Flow | 0.12 | Buy |
| Average Directional Index | 16.057 | Neutral |
| MACD (12, 26) | -0.006 | Sell |
| Bull Bear Power | -0.052 | Sell |
| Stochastic %K (14, 3, 3) | 34.80 | Neutral |
| 20-Day EMA | 1.449 | Sell |
| 50-Day EMA | 1.399 | Sell |
| 100-Day EMA | 1.329 | Buy |
| 200-Day EMA | 1.348 | Buy |
| Volume Weighted Moving Average (20) | 1.492 | Sell |
BAND Price Prediction Tomorrow and Next Week
| Date | Price | Change |
| November 28 | $1.415347 | 0.00% |
| November 29 | $1.38533 | -2.10% |
| November 30 | $1.39300 | -1.23% |
| December 01 | $1.43510 | 1.40% |
| December 02 | $1.50047 | 6.01% |
| December 03 | $1.614134 | 13.42% |
| December 04 | $1.736463 | 22.71% |
The predicted price data is based on the monthly and weekly performance of the BAND.
BAND Price Prediction FAQs
What is BAND’s Price Today?
Based on the BAND prediction chart, the price of BAND declined by 3.40% and reached $1.391 by November 27, 2023.
Is BAND a Good Investment?
Band Protocol would need to gain 7,087.90% to reach $100. As per the BAND price algorithm, the maximum expected price our algorithm estimates is $ 10.27.
What is the all-time high of BAND?
BAND crypto has an all-time high price of $23.19, the current price is 93.93% below the record-high price.
What is the Intraday Trading Volume of BAND?
The BAND has an intraday trading volume of $7.7 Million with an increase of 15% during Monday’s session.
Will BAND Reach $10?
BAND would need to rise above 7300% to reach the $10 threshold. The highest expected price for the BAND token is $0.398396.
Conclusion
The market sentiments for the BAND token are bearish and the price is moving in a sideways path. Most of the major technical indicators are generating a sell signal in the market. The buyers need more buying volume to make a sustainable upward move in the market.
Technical Levels
| Levels | Value(USD) |
| Support 2 | $1.181 |
| Support 1 | $1.357 |
| Price | $1.391 |
| Resistance 1 | $1.578 |
| Resistance 2 | $1.843 |
Disclaimer
Investing in stocks and other Initial Coin Offerings (“ICOs”) is especially volatile and speculative, and this article does not advise investing in cryptocurrencies, stocks, or other ICOs. Since everyone has their uniqueness, a certified professional should be continually consulted before making any economic decisions.


