

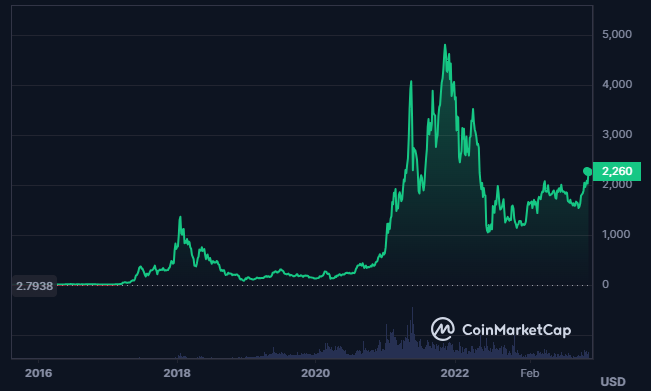
- The ETH crypto has given a return of more than 75% in one year.
- There is significant activity recorded in the trading volume of the crypto.
Ethereum is a decentralized blockchain platform that runs smart contracts and has its own cryptocurrency, Ether. It was launched in 2015 after a crowd sale in 2014. It aims to be a global platform for decentralized applications that are censorship-resistant, secure, and reliable.
The ETH has a market cap dominance of 16.846% as per the Coingecko. The current volume/market cap ratio of the crypto is 0.0785 and the market cap rank of the crypto is #2. The crypto price is trading above 521,474% of its all-time low price.


The largest volume of the ETH crypto is traded on the USDT pair and the fully diluted market cap of the ETH coin is $271.05B following a total supply of 120.23M ETH and the max supply is infinite. Also, the circulating supply of the crypto is similar to its total supply.
ETH Crypto Derivatives Analysis
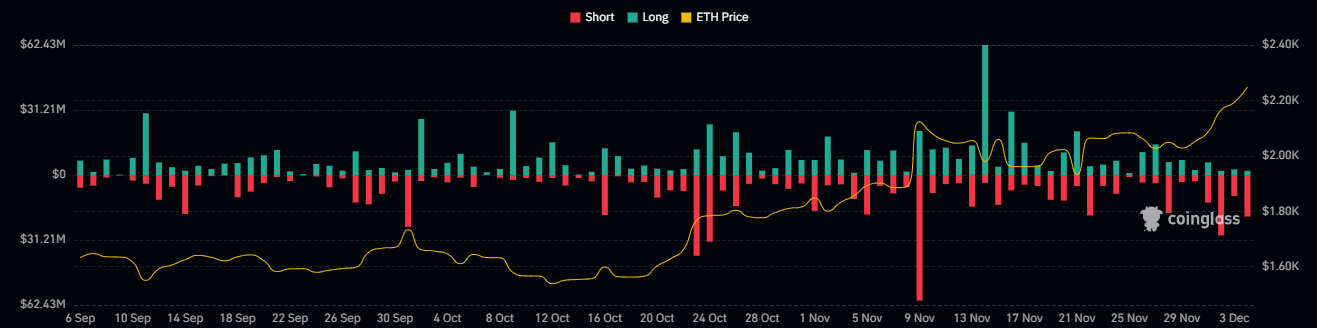
The derivative trading volume of the ETH crypto has advanced by 18.23% in the last 24 hours resulting in $21.35B. Moreover, the options volume has declined by 51.55% and the open interest has advanced by 1.63%. The long/short ratio of the crypto is 1.0375.
Ethereum Volume Analysis
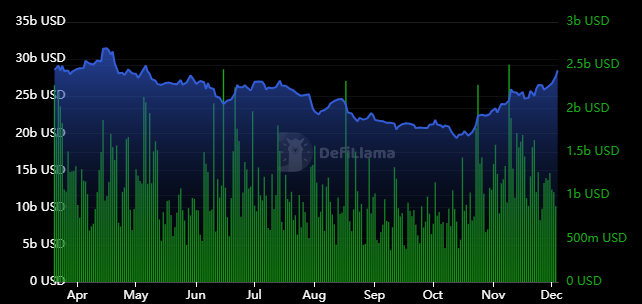
The trading volume of the Ethereum coin is constantly witnessing some fluctuation over time. It is further followed by constant TVL of the crypto. Also, the current market cap of the Stablecoins is $66.573B.
ETH Crypto Technical Analysis

The Ethereum crypto price is slowly advancing to higher levels. The following behavior of the crypto price has led to the formation of a rising wedge pattern on the weekly charts. The Ethereum price has advanced by more than 45% from the most recent swing low of $1520.00.
The Ethereum coin price is consistently forming a higher high pattern on the charts breaking above the previous swing highs. This behavior in the crypto price shows that the price is following a strong uptrend, which might lead the crypto price to new highs.
The indicators such as the 50-day and the 200-day EMAs are trading in a death cross on the charts. The price of the crypto is also advancing with the advance in the values of the indicators.
The MACD indicator is also giving a bullish signal on the daily timeframe as the signal line and the MACD line are trading above the zero level. On the indicator, bullish volume blocks are building up as the price is gaining momentum.
Conclusion
Ethereum has shown a positive trend, breaking above a rising wedge pattern and gaining more than 45% since the recent low. Ethereum is also supported by the bullish crossover of the EMAs and the MACD indicator. Ethereum has a lot of potential to grow further based on the current technicals.
Technical Levels
- Support levels- $1085 and $1550
- Resistance levels- $3530 and $4870
Disclaimer
The views and opinions stated by the author or any other person named in this article, are for informational purposes only and do not constitute financial, investment, or other advice. Investing in or trading crypto or stocks comes with a risk of financial loss.


