

- The ETC crypto price has broken above the crucial trading zone.
- In the last 24 hours, the Ethereum Classic trading price has declined by 3.5%.
Ethereum Classic is a decentralized platform that runs smart contracts and dApps on proof-of-work blockchain. It was created by a group of Ethereum users who rejected a hard fork that reversed a hack. It values immutability and censorship resistance. ETC is its native cryptocurrency.
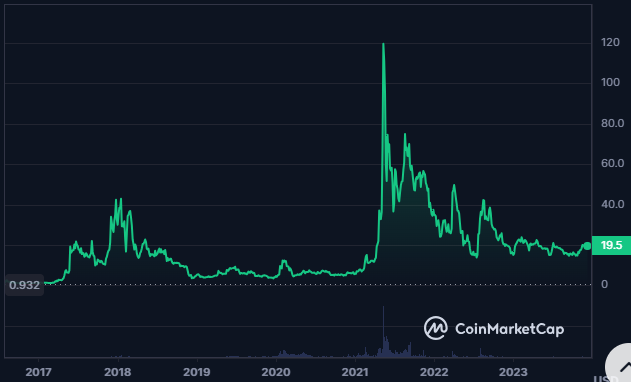
Being launched in the year 2016, the ETC crypto hit its all-time high price of $167.09 in April 2021. The trading volume of the ETC crypto has advanced by 29.95% in the last 24 hours. It has resulted in a traded volume of $289.93M.


The market cap of the ETC crypto has declined by 4.22% in the last 24 hours. Despite this, the volume of crypto has resulted in a surge. This behavior in the price data represents the possibility of the price trying to break below the current levels.
The current volume/market cap ratio of the ETC crypto is 0.0811. It also has a max supply of 210.7M followed by a fully diluted market cap of $4.102B.
Ethereum Classic Crypto Price Volatility Comparison
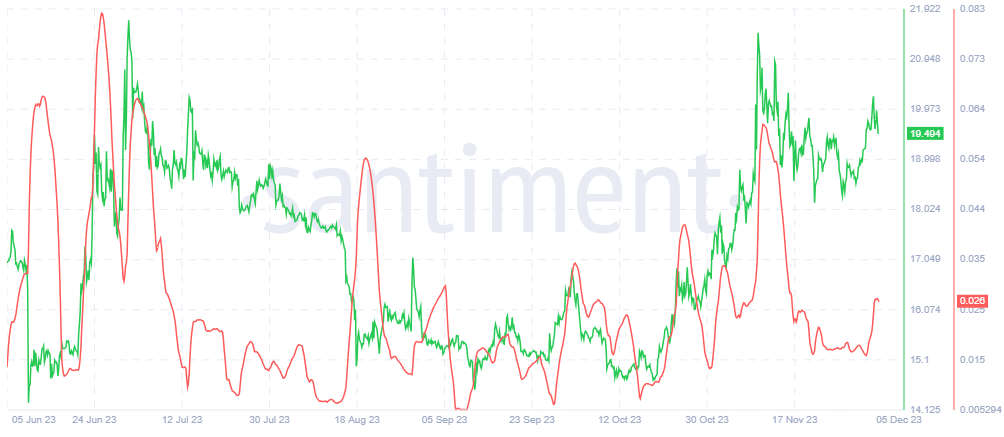
The Santiment chart shows that the price of the Ethereum Classic has slightly declined from the higher levels following a similar trend in the volatility of the crypto. Looking at the most recent scenario the volatility of the ETC, it is advancing while the price is trading in a small range.
ETC Crypto Technical Analysis
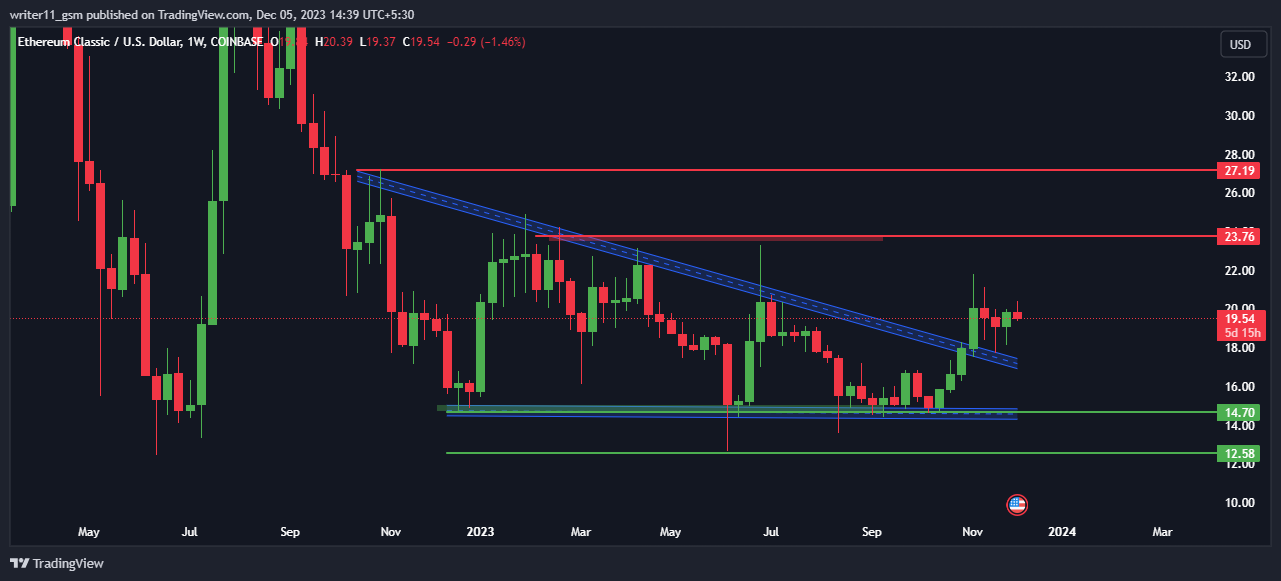
After declining to certain lows and losing its value by more than 90%, the ETC crypto price formed a descending triangle pattern on the chart. Moreover, the crypto has broken above the triangle pattern witnessing dominance of buying pressure. This behavior of the price shows the potential for further advance in its value in the future.
ETH/USD Chart by TradingView.com
The 20-day and the 50-day have crossed above the 200-day EMA, indicating a strong presence of buyers and leading to a golden crossover. Thus, the ETC crypto price is currently following a strong uptrend and might continue to advance to higher levels.
After hitting the highs of the overbought zone in the daily timeframe chart, the RSI is declining to lower levels. Despite that, the RSI is still sustaining above the 50 level. It shows the crypto is still left with bullish momentum and might continue to advance to higher levels.
Conclusion
Ethereum Classic is a PoW blockchain for smart contracts and dApps. Its native token “ETC” is following a bullish trend, breaking above the triangle pattern. It has EMAs and RSI support as they are giving bullish signals on the daily chart. It is a secure and immutable platform. The following factors indicate that the crypto price might continue to advance to higher levels.
Technical Levels
- Support levels- $13.50 and $17.80
- Resistance levels- $43.50 and $54.20
Disclaimer
The views and opinions stated by the author or any other person named in this article, are for informational purposes only and do not constitute financial, investment, or other advice. Investing in or trading crypto or stocks comes with a risk of financial loss.


