

- The open interest of Shiba Inu crypto is witnessing significant activity.
- SHIB is trading at $0.000009095, witnessing an advance of 13.3% in the last 30 days.
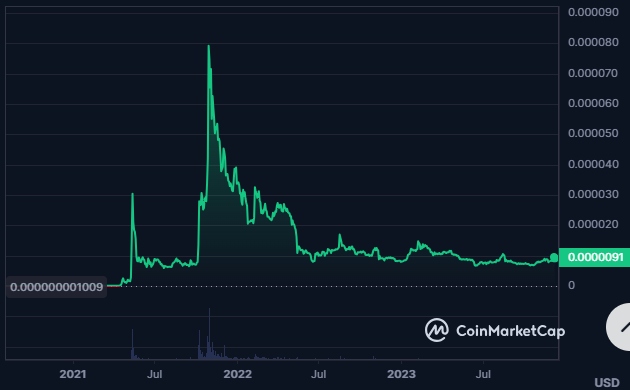
Shiba Inu (SHIB) is a meme-inspired cryptocurrency that runs on Ethereum. It is a community project with three tokens: SHIB, LEASH, and BONE. It also has a decentralized exchange, ShibaSwap, and other features like NFTs, Metaverse, games, and DAO. It is different from Dogecoin in its ecosystem and utility.
The market cap of the SHIB crypto has declined by 1.03% in the last 24 hours, following a decline of 6.16% in the spot trading volume and an advance of 2% in the derivatives trading volume.


The SHIB coin has a market cap rank of #18 as per Coingecko. This cryptocurrency has a market cap dominance of 0.331%. Currently, the SHIB coin has a volume/market cap ratio of 0.09 and a fully diluted market cap of $9.10B.
Shiba Inu Derivative Data Analysis
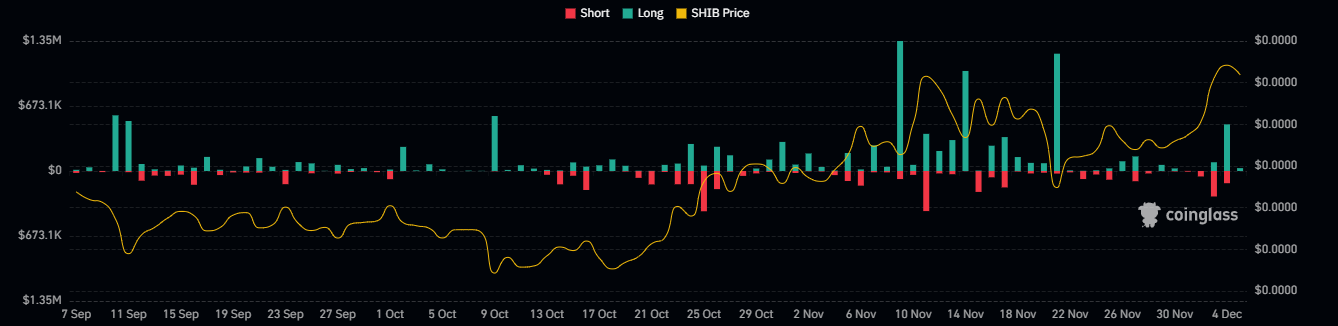
Witnessing a higher long liquidation followed by the last 24 hours, technical charts show the buying pressure. Moreover, the derivative trading volume is flat. It shows that the crypto price is taking a pause and accumulating the volume. Also, the long/short ratio of the SHIB is 0.8975.
SHIB Crypto Technical Analysis
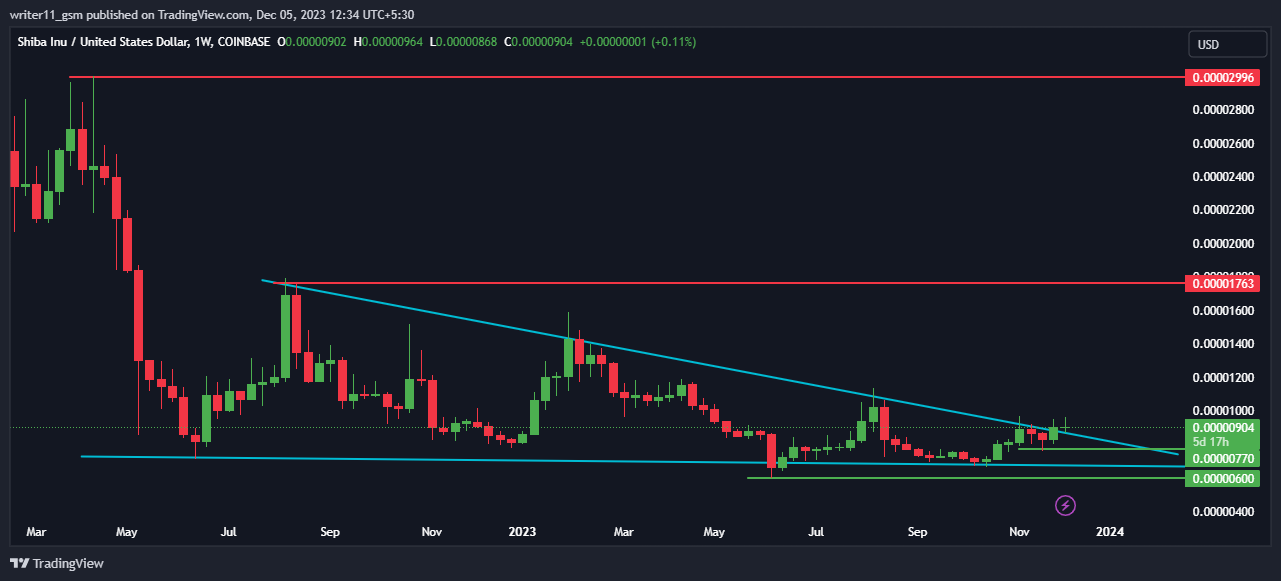
Forming the dynamic lower low pattern, the SHIB crypto was facing a decline at the dynamic trendline. This behavior led to the formation of a declining triangle pattern and the price has recently broken above the same. This breakout might lead to higher levels of $0.00001760.
SHIB/USD Chart by TradingView.com
The RSI on the daily chart of SHIB crypto is following a bullish cycle currently trading at 61.46. The 14-day SMA line is currently trading at a level of 53.63. As the RSI value is trading higher than the SMA, this indicates the bullish momentum in the crypto price.
The EMAs such as the 50-day and the 200-day EMAs are trading in a golden cross. The value of the EMAs is consistently advancing with the advance in the crypto price.
Conclusion
SHIB is an Ethereum-based meme coin with a bullish trend. It broke a triangle pattern and rose over 20% from the most recent swing low. It has EMAs and RSI support giving a bullish signal. It is a unique and innovative GPU-powered project and a promising token.
Technical Levels
- Support levels- $0.00000600 and $0.00000770
- Resistance levels- $0.00001760 and $0.000002990
Disclaimer
The views and opinions stated by the author or any other person named in this article, are for informational purposes only and do not constitute financial, investment, or other advice. Investing in or trading crypto or stocks comes with a risk of financial loss.


