
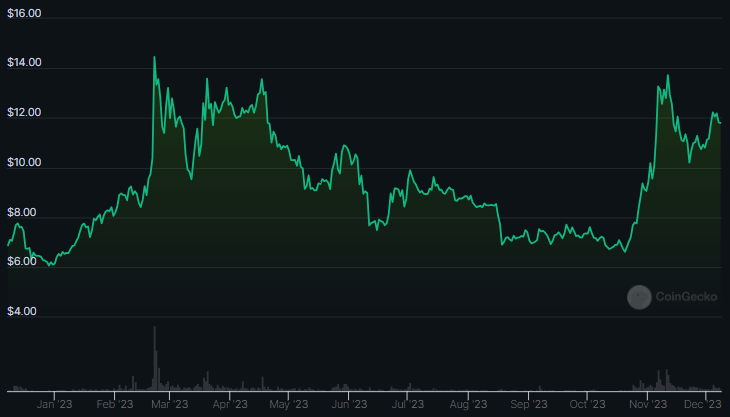
- The NEO crypto is trading at 16000% above its all-time low price.
- The trading volume of the NEO coin is witnessing a decline followed by the last 24 hours.
NEO (NEO) is a blockchain platform and cryptocurrency created by Da Hongfei and Erik Zhang. Launched as AntShares in 2014, it was rebranded to NEO in 2017.
NEO enables the development of decentralized applications (dApps) and smart contracts, while its native token, GAS, facilitates transactions and computational resources. It serves as both a utility and a store of value in the crypto space.


The market cap of the NEO crypto is trading flat with the price change resulting in a decrease of 0.02% in the last 24 hours. Moreover, the trading volume of the crypto has also declined by 28.35% resulting in $78.846M.
The volume/market cap ratio of the crypto is 10.01%, resulting in a market cap rank of 69th as per CoinMarketCap. The NEO coin has a total supply of 100.0M NEO followed by a fully diluted market cap of $1.184B.
NEO Derivatives Analysis
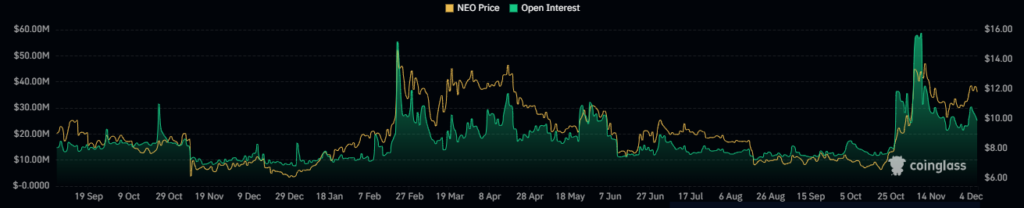
The open interest of the crypto has been trading flat for the last 24 hours, resulting in $26.23M. The derivative volume of the NEO has also declined by 41.62% resulting in a long/short ratio of 0.9066. Moreover, the crypto has resulted in a long liquidation of $74.43K, which is higher than the short liquidation.
NEO Crypto Technical Analysis
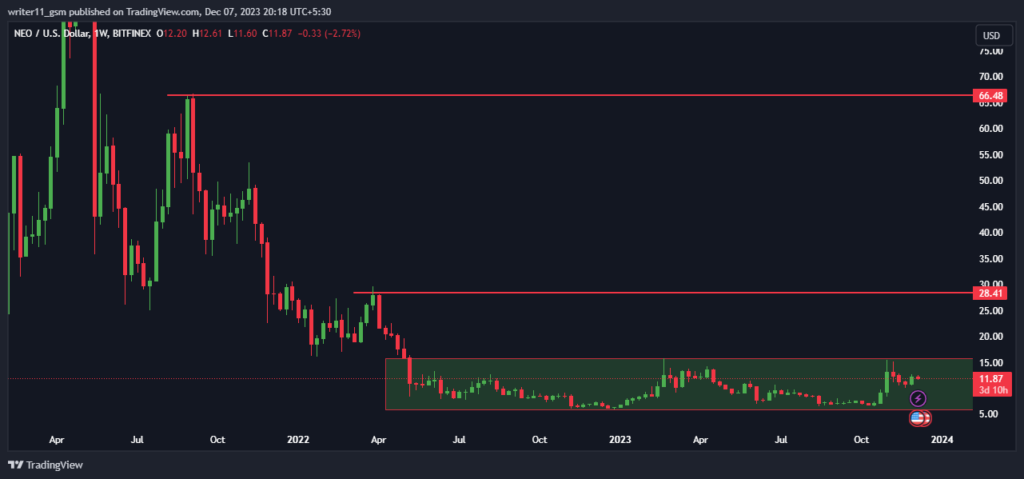
The NEO crypto price is trading in a small zone, consolidating for a long time. It is a sign of price accumulation, which indicates that on breakout there can be a huge move in either direction.
NEO/USD Chart by TradingView
NEO cryptocurrency exhibits a bullish trend as its price is currently trading above the 20, 50, and 200 Exponential Moving Averages (EMA), forming a golden cross, and signaling a potential upward momentum.
NEO cryptocurrency’s Relative Strength Index (RSI) is at 54.48, indicating a decline from overbought levels. For a bullish outlook, sustained levels above 50 are crucial, suggesting potential positive momentum.
Conclusion
NEO crypto displays consolidation in a tight range, with a notable increase from its all-time low. Despite technical indicators suggesting a bullish trend, it’s prudent for investors to await a confirmed breakout above the current zone before making any significant trading decisions.
Technical Levels
- Support levels– $6.50 and $10.00
- Resistance levels– $28.00 and $48.00
Disclaimer
The views and opinions stated by the author or any other person named in this article, are for informational purposes only and do not constitute financial, investment, or other advice. Investing in or trading crypto or stocks comes with a risk of financial loss.


