

- In the last 14 days, the Polkadot crypto price has advanced by 32.9%.
- The community of the Polkadot is bullish as per Coingecko.
Polkadot was founded by Ethereum co-founder Gavin Wood and the Web3 Foundation in 2016. Polkadot is a blockchain network that allows users to create and run their own blockchains, called parachains, on top of a main relay chain. DOT is the network’s native cryptocurrency and it also acts as a governance token.
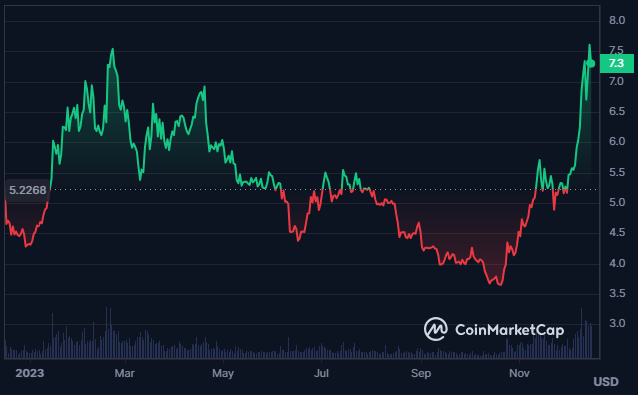
The DOT token reached its peak at $54.98 more than two years ago, and since then, the cryptocurrency has struggled to surpass this previous high. This prolonged inability to break the record suggests a lack of optimism among traders and investors over the past two years. Additionally, the current market cap of the DOT has witnessed a 3.86% advance in the last 24 hours.


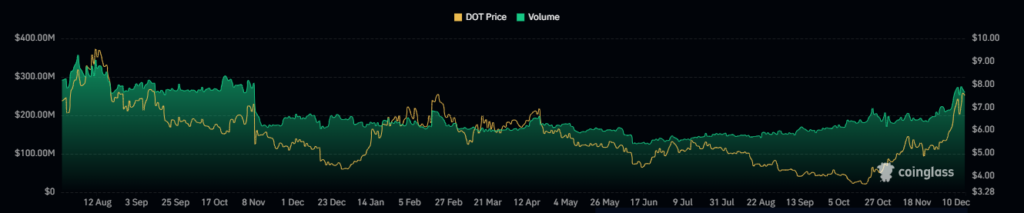
The volume of the DOT crypto is trading flat, witnessing a decline of 0.25% in the last 24 hours. Besides, there has been no significant activity seen in the derivatives of the crypto.
The current volume/market cap ratio of DOT is 5.00%. It has a total supply of 1.388 Billion DOT. The max supply of the crypto is infinite and the circulating supply of the crypto is 1.318B DOT.
DOT Crypto Derivatives Analysis
The open interest of the DOT crypto has witnessed a decline of 4.8% in the last 24 hours followed by a slight advance of 12% in the trading volume of the crypto. Moreover, the derivative trading volume of the crypto results in $858.43M. The long liquidation for the crypto is very high resulting in $1.72M.
DOT Crypto Technical Analysis
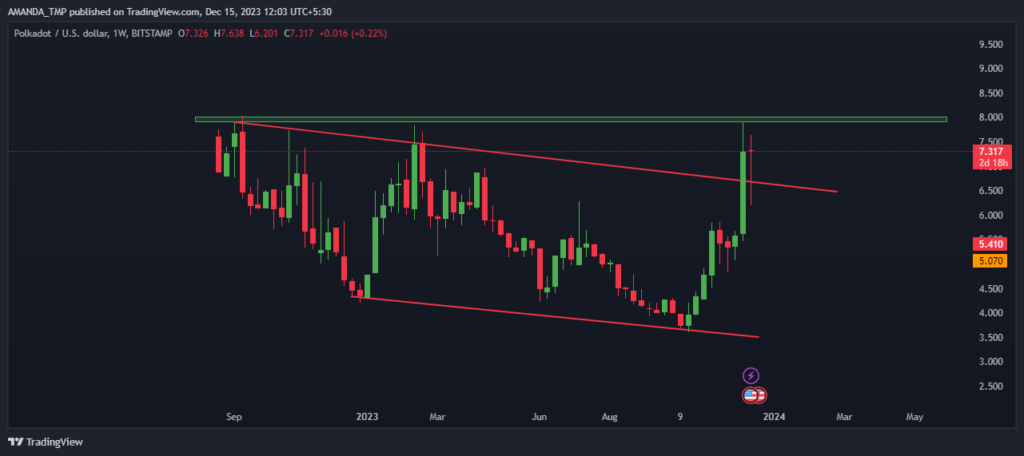
The DOT crypto price was trading inside a falling wedge pattern and the price has recently broken above the same pattern. It has formed a very strong bullish candle and is currently forming an inside candle on a weekly timeframe.
DOT/USD Chart by TradingView
The Polkadot price is trading above the median line of the Bollinger Band and has also broken above the upper band. Therefore, the price might come for a retracement in the upcoming days before leading to further highs.
The MACD is also trading above the zero level, following a golden cross of signal and MACD line. It is also forming bullish volume blocks on the daily timeframe of the crypto.
Conclusion
The DOT crypto price has shown a strong bullish momentum in the last two weeks, breaking out of a falling wedge pattern and reaching new highs. The technical indicators suggest that the price may continue to rise in the near future because the market sentiment is positive and the volume is increasing. However, some correction may occur before the next rally, as the price is overbought and may face some resistance.
Technical Levels
- Support levels: 3.60 and $4.90
- Resistance levels: 8.06 and $10.00
Disclaimer
The views and opinions stated by the author or any other person named in this article, are for informational purposes only and do not constitute financial, investment, or other advice. Investing in or trading crypto or stocks comes with a risk of financial loss.


