

- Technical indicators are indicating a strong sell signal for the GMX crypto.
- In the last 24 hours, the crypto has witnessed a long/short ratio of 0.9227.
GMX is a DEX for trading crypto futures with low fees and high liquidity. It uses Chainlink Oracles and a multi-asset pool to provide dynamic pricing. The GMX token holders can enjoy various benefits and incentives within the platform. GMX’s founders are unknown.
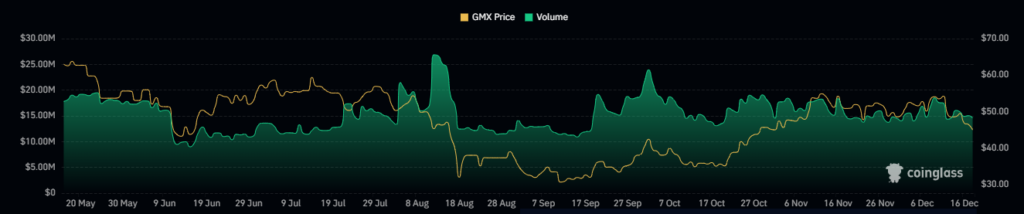
The market cap dominance of GMX is 0.025% and a market cap ranking of #138. The trading volume of the crypto has declined by 10% in the last 24 hours, this has resulted in a traded volume of $15.834M.


The market cap of the crypto has also declined by 3.2% and the current market cap of the crypto is $406.055M. Its volume/market cap ratio is 4.09%.
The circulating supply of the GMX crypto is 9.284M GMX and the total supply of the crypto is 9.696M GMX. Moreover, the max supply is infinite while the fully diluted market cap is $422.142M.
GMX Crypto Derivatives Analysis
Followed by a higher long liquidation of the GMX crypto, the derivatives trading volume has declined by 3.6%. Also, the open interest has declined by 2.08% resulting in $14.16M. Despite this, the short liquidation for the crypto is null in the last 24 hours.
GMX Crypto Technical Analysis
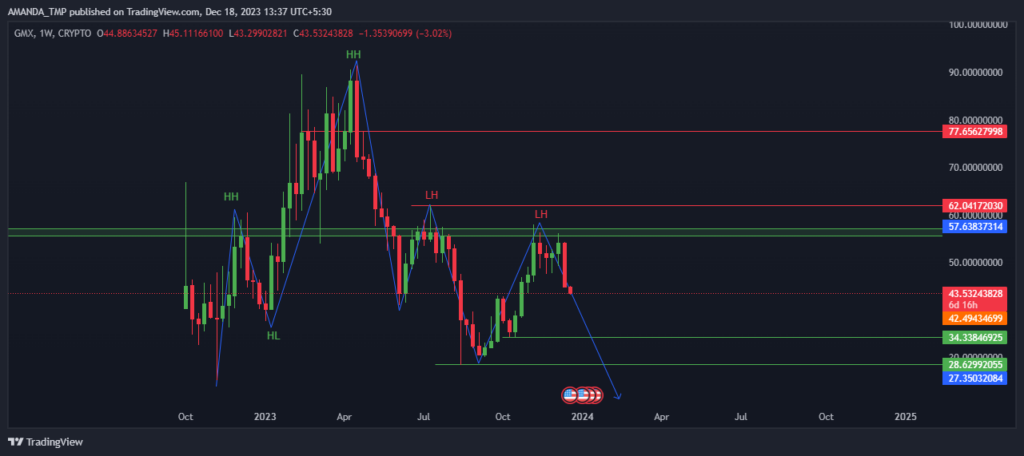
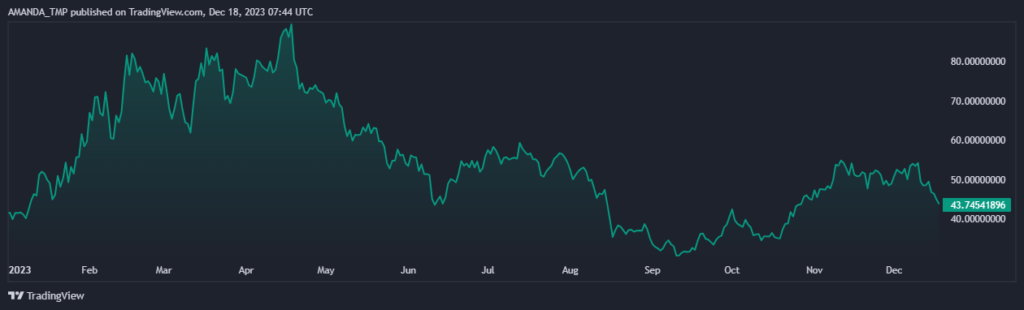
After hitting an all-time high price of $91.07 by forming a higher high structure, the GMX trading price witnessed a decline of more than 50%. This decline led to the formation of lower highs on the crypto chart.
The crypto is still following the same downtrend and has formed a bearish pattern after facing rejection at the level of $56.00. It led to the formation of a double-top pattern.
GMX/USD Chart by TradingView
The GMX crypto price has declined below the 200-day EMA and is also trading below the median line of Bollinger Band. The price has also crossed below the lower band of the Bollinger band indicator on the daily chart of the crypto.
The signal line and the MACD line have declined below the zero level trading with a death cross. The following behavior of the indicator shows the dominance of sellers in the market.
Conclusion
The GMX crypto is facing a strong downtrend and a bearish continuation pattern. The technical indicators are signaling a sell-off and a possible breakdown of the support level. The GMX token may test the previous low of $28.00 or even lower soon
Technical Levels
- Support levels- $28.60 and $34.30
- Resistance levels- $62.040 and $77.650
Disclaimer
The views and opinions stated by the author or any other person named in this article, are for informational purposes only and do not constitute financial, investment, or other advice. Investing in or trading crypto or stocks comes with a risk of financial loss.


