

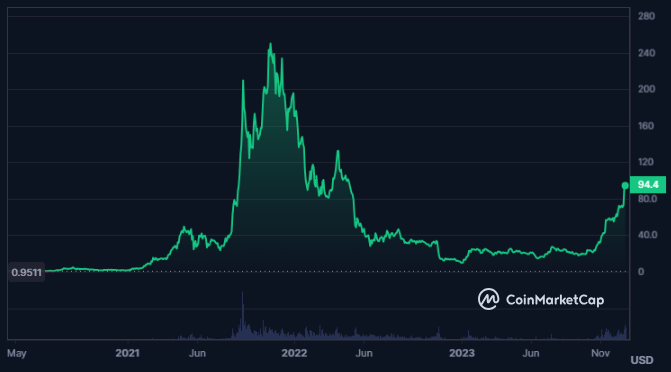
- The SOL crypto price has advanced by 680% during the last year.
- The Solana crypto price has advanced by 18000% from its all-time lows.
Solana is a scalable blockchain platform that uses PoH and PoS consensus mechanisms to achieve high performance. Its SOL token is used for fees, contracts, and staking. Solana supports various decentralized applications and has processed billions of transactions.
Although the trading volume of the Solana crypto has declined by 18.5% in the last 24 hours, but it has witnessed good volume activity in the last few days. The price of the SOL crypto also has witnessed an impressive surge.


Also, the market has witnessed a decline of 4.4% in the last 24 hours. The current market cap of crypto is 40.397B and as per CoinmarketCap, its ranking is 5th in other cryptocurrencies.
Solana is trading with a volume/market cap ratio of 11.13% and has a circulating supply of 427.337M SOL. Moreover, the total supply of the crypto is 565.381M SOL followed by an infinite max supply.
What Does Solana Derivates Data Say About Crypto?
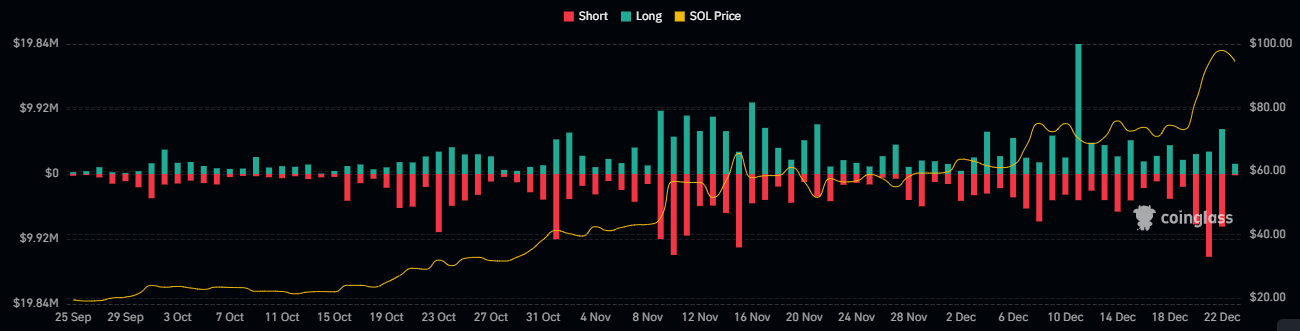
Solana has witnessed a higher long liquidation of $6.80M against the short liquidation of $4.94M indicating the dominance of sellers in the last 24 hours. It represents a small profit booking in the crypto.
Also, the derivatives trading volume of the crypto has declined by 19.8% in the last 24 hours and the open interest has also declined by $1.26B. Moreover, the long/short ratio of the crypto is 0.9566.
SOL Crypto Technical Analysis
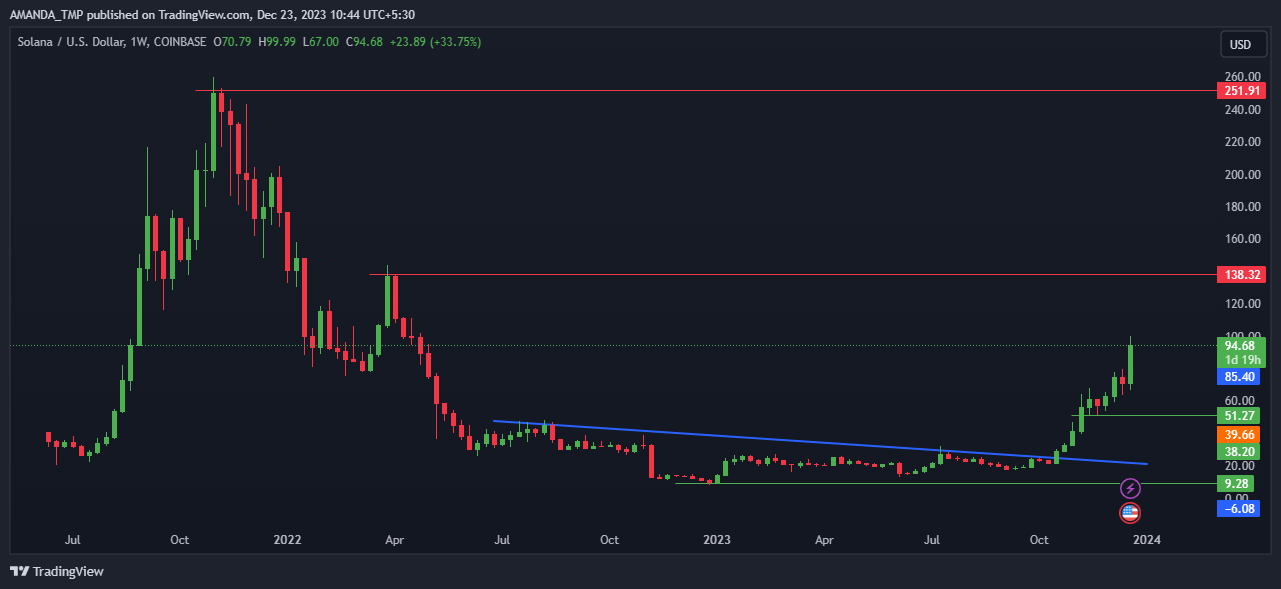
After facing a consistent decline in the crypto trading price, the SOL coin price formed a descending triangle pattern at the bottom of the weekly chart. The price further broke out above the pattern with strong momentum leading to a change in trend to bullish.
SOL/USD Chart by TradingView.com
The SOL crypto price is trading above the crucial EMAs like the 50-day and the 200-day EMAs and is following a golden cross on the daily charts. The value of the Bollinger band is also advancing to higher levels. This behavior of the indicators replicates a strong uptrend in the trading price.
The RSI is also trading above the overbought zones and has advanced above the 14-day SMA. Currently, the RSI is trading at a level of 72.18 on the daily charts and the 14-day SMA is at 65.75. That shows a bullish cross in the RSI indicator.
Conclusion
The SOL crypto is a fast and scalable blockchain platform that supports various decentralized applications. It has shown massive growth and a strong uptrend in the past year. This coin’s price has a high probability of reaching new highs if it sustains its bullish momentum.
Technical Levels
Support Levels: $9.20 and $51.20
Resistance levels:$138.30 and $251.90
Disclaimer
This article is for informational purposes only and does not provide any financial, investment, or other advice. The author or any people mentioned in this article are not responsible for any financial loss that may occur from investing in or trading. Please do your research before making any financial decisions.


