

- Tron crypto trading with flat change in its volume in the last 24 hours.
- Following the last 1 year, the TRX token has given a return of 89% to its investors.
Tron is a blockchain platform that aims to create a decentralized internet and its infrastructure. Tron supports DApps, smart contracts, and DeFi services. TRX is the native token of Tron, used for paying fees, staking, and governance. This platform was created by H.E. Justin Sun, who also acquired BitTorrent.
The Tron token uses the DPOS consensus mechanism and the SHA_256 hashing algorithm for hashing blocks and transactions. It was launched on 28 August 2017 and the TRX token hit an all-time high price of $0.231673 in January 2018.


The market cap dominance of the Tron is 0.534%, followed by a decline of 3.4% in the last 24 hours. The current market cap of the crypto is $9.072B ranking 14th as per CoinMarketCap.
Tron crypto has witnessed higher long liquidation in the last 24 hours, resulting in $108.33K. This is followed by a short liquidation of $5.01K, which represents that the sellers have ruled over the price in the last 24 hours.
Tron Token Overview

The current circulating supply of the Tron token is 88.35B TRX and the total supply of the crypto is 88.35B TRX. Moreover, the max supply of the crypto is infinite and the fully diluted market cap of Tron Crypto is $9.078B. The holders for the token have also advanced resulting in 4.7K, resulting in a total transfer of 19.8K.
TRX Crypto Technical Analysis
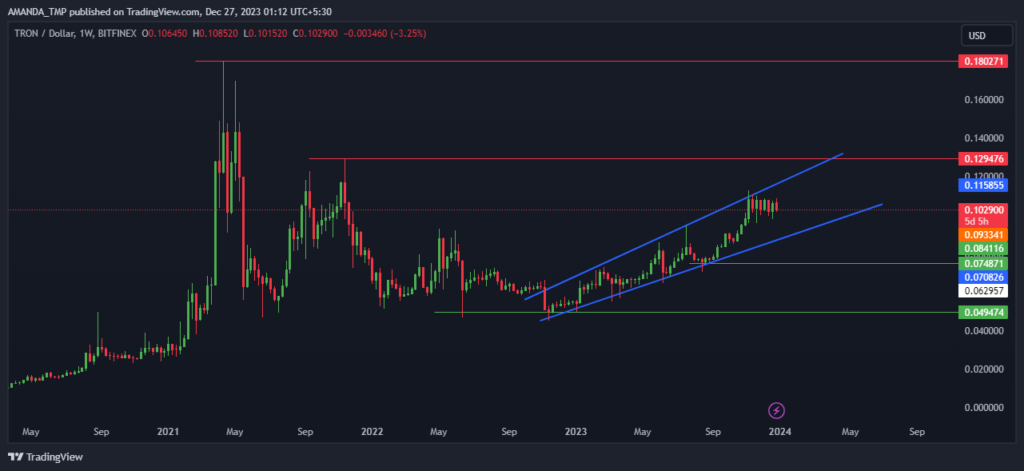
The Tron crypto price is gaining momentum on the buying side as it is advancing to higher levels. It is forming higher high swing levels leading on the upside with an expanding wedge pattern. The price is currently trying to take resistance at the upper band of the wedge pattern, but the price might continue to advance to higher levels.
TRX/USD Chart by TradingView
With the consistent advance in the trading price of the TRX crypto price, indicators like the EMAs and the Bollinger Bands are giving a bullish signal on the charts. The EMAs are trading in a golden cross on the daily chart with the crypto chart trading above the same.
The RSI on the other side has declined below the 50 level breaking below the 14-day SMA. This behavior of the RSI shows that the TRX price might be coming for a retracement in the price.
Conclusion
TRX crypto price is showing a strong bullish trend as it breaks above an expanding wedge pattern. This Crypto has a high market cap, volume, and demand, reflecting its potential and popularity. Tron is a leading blockchain platform that offers various services and features. TRX is a good investment option for the future.
Technical Levels
Support Levels: $0.050 and $0.0750
Resistance levels:$0.130 and $0.180
Disclaimer
This article is for informational purposes only and does not provide any financial, investment, or other advice. The author or any people mentioned in this article are not responsible for any financial loss that may occur from investing in or trading. Please do your research before making any financial decisions.


