

- Major indicators like RSI, and EMAs show bearish traits regarding the GAS price.
- The GAS price action is exhibiting a bearish perspective at the publishing time.
Gas is basically a crypto token that functions as a constituent fuel to the NEO blockchain, whereas NEO is a platform that allows and lets smart contracts and decentralized applications.
Moreover, Gas crypto also supports the functioning and growth of the NEO blockchain.


Gas is used to pay for the processing and storage resources required to run the network. In general, Gas is produced as a reward or prize for validating the blocks on the NEO blockchain, and its supply is permanently fixed at 100 Million tokens.
Besides, Gas holders can use their tokens to join in the governance of the NEO network, as well as to access various services and applications built on NEO.
Furthermore, NEO has a dual-token model, where NEO is the governance token and Gas is the utility token.
NEO holders can stake their tokens to generate Gas, and also vote on network settings and consensus nodes. Gas bearers can even use their crypto holdings to pay for network fees and access various attractive dApps and services on NEO.
What Does the GAS Crypto Price Chart Show?
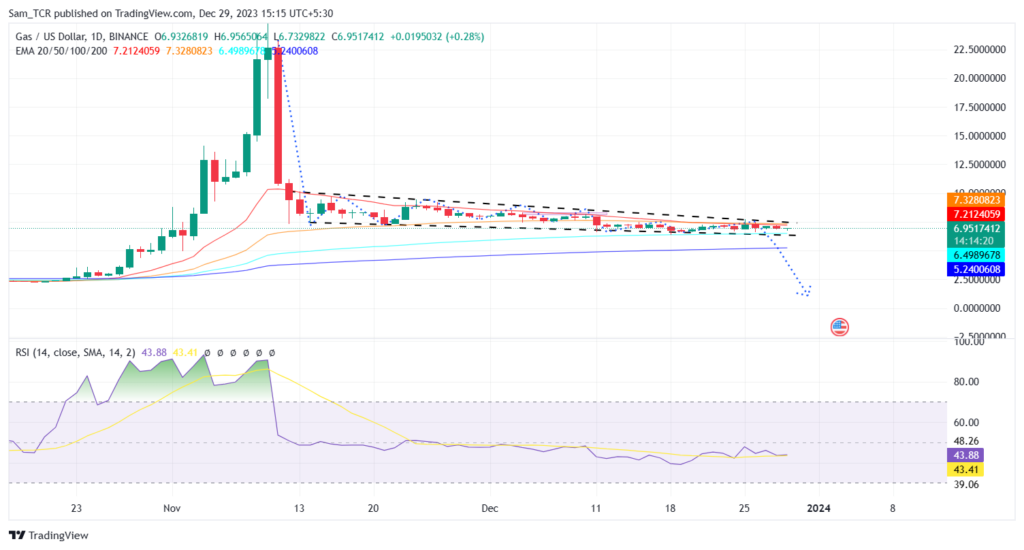
The GAS asset is showing bearish traits and is expected to do so in the coming sessions. It demonstrated poor performance in the past week, and one month, indicating an upcoming downward trend.
The GAS crypto experienced a 0.12% surge in the last 24 hours and was trading at $6.9406 at press time. Therefore, if the demand for the GAS rises, the asset price could bounce back from the current level. The next goal for the GAS price is to reach $8.
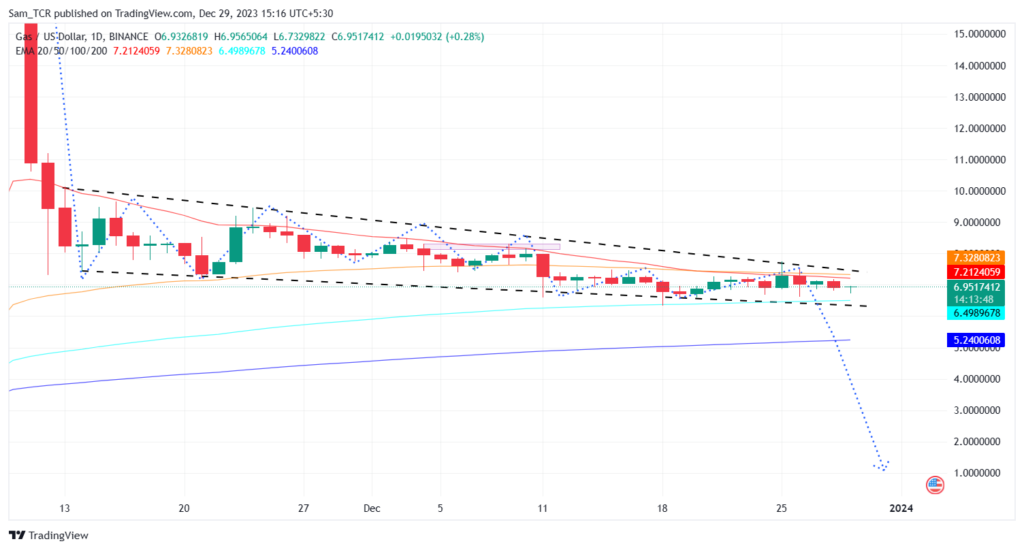
However, if the GAS crypto price fails to stay above the $6 level, it could decline further. The GAS asset is showing bearishness and declining potential as it drops below major EMAs.
The asset is in a strong downtrend with a downward converging wedge and the RSI shows no signs of oversold conditions, suggesting that the asset has more room to fall.
Summary
The GAS price chart demonstrates the bearish sentiments and perspectives regarding the asset in the one-day time frame. The technical parameters of the GAS price suggest the continuation of the downtrend, reliant on the seller’s surge, over the daily time frame chart.
The RSI and EMAs highlight bearish traits regarding the GAS price. Therefore, it can be inferred that if the GAS crypto price fails to stay above the $6 level, it could decline further.
Technical Levels
Support Levels: $6
Resistance Levels: $8
Disclaimer
In this article, the views, and opinions stated by the author, or any people named are for informational purposes only, and they don’t establish the investment, financial, or any other advice. Trading or investing in cryptocurrency assets comes with a risk of financial loss.


