

- Moving Averages are technical indicators used to analyze the current trend.
- They are trade signals for buying or selling.
- Simple Moving Averages and Exponential Moving Averages are most commonly used in trading.
Traders rely on several Technical indicators for signals to buy or sell their assets. Moving Average is a technical indicator used to identify the current stock trend and give signals of buying or selling. It is used to include continuously fresh data in the average so that the latest price is not neglected.
Average and Moving Average
Average:


A simple arithmetic average is calculated by summing the total factors divided by total factor generators.
| Person | T-Shirts Owned |
| A | 10 |
| B | 13 |
| C | 9 |
| D | 12 |
| E | 14 |
The average number of T-shirts owned by a person can be calculated by:
(10+13+9+12+14) / 5 = 11.6
11.6 is the avg of this data.
Moving Average:
Moving averages are calculated for periods and include the latest data. Let’s understand this through an example:
The list shows the closing price of Apple Inc over the last five days.
| Date ( May 2023) | Closing Price |
| 15 | 172.07 |
| 16 | 172.07 |
| 17 | 172.69 |
| 18 | 175.05 |
| 19 | 175.16 |
The average for these 5 days will be:
(172.07 + 172.07 + 172.69 + 175.05 + 175.16) / 5 = 173.408
Now, we move to the next 5 days:
| Date ( May 2023) | Closing Price |
| 16 | 172.07 |
| 17 | 172.69 |
| 18 | 175.05 |
| 19 | 175.16 |
| 22 | 174.20 |
The average for these 5 days will be:
(172.07 + 172.07 + 172.69 + 175.05 + 174.20) / 5 = 173.216
Similarly, we will move to the next 5 days i.e. 17 to 23; then the next 5 days i.e. 18 to 24, and so on.
This is an example of a 5-day Moving average. It’s called moving simply because we move to the next day and ignore the last day, thus, bringing in the latest price.
Exponential Moving Average
Exponential differs from simple moving averages in the fact that we give importance to the data points here.
In a simple moving average, all data points are considered equally valuable hence equal weightage. However, we know that some days are more important than others, especially if they are the launch date of new technology or political events.
Calculating EMA:
ET = (ValueT* ( s / 1+ days)) + EY*(1-(s / 1+ days))
ET = EMA today s= Smoothing
EY= EMA yesterday days is 5day, 10 day or 20 day average
ValueT = Value today
s= (2 / (days + 1))
Graph with SMA and EMA:
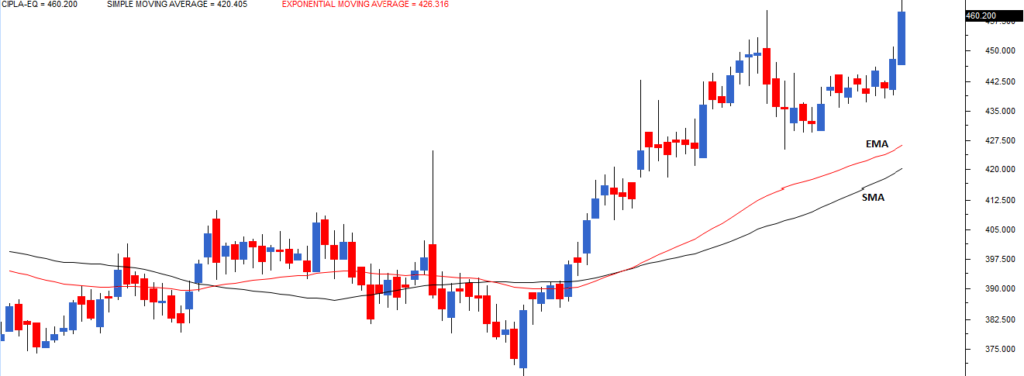
The above graph shows the comparison between EMA and SMA. As we can observe, EMA shows better results for immediate price changes. Many experienced traders prefer EMA over SMA.
Use of EMA and SMA in Trading
This section will cover how traders use SMA and EMA for different purposes, like determining the trend, support, and resistance bars, and buying or selling signals.
- If the current price is higher than the SMA, it means the price now is higher than the average price and a positive signal for buying. The price will rise.
- If the current price is lower than the SMA, it means the price is less than its average value, a positive signal to sell. The price will fall.
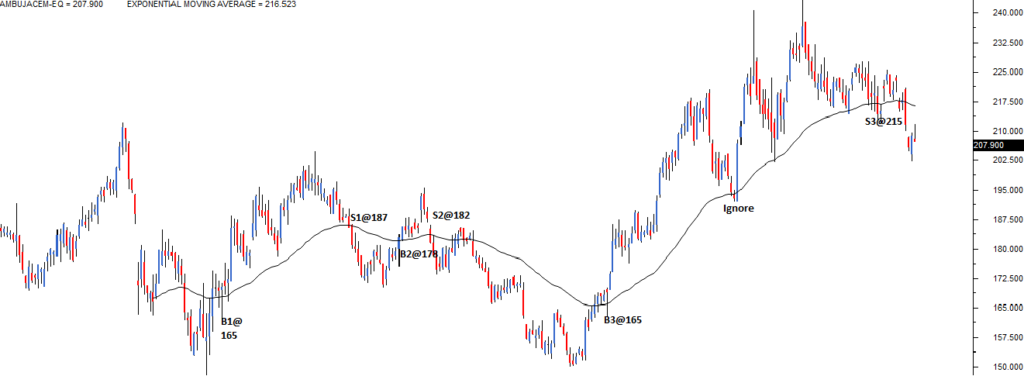
Let’s analyze this graph and understand how a trader will use SMA.
B1: This indicates the point when the price went above the SMA line. Traders will now be engaged in buying.
S1: This indicates when the price went below the SMA line. Traders will sell their stocks to prevent losses.
B2, B3 and S2, S3: They also represent similar signals for entering into buying or selling.
It is important to observe the profit returns in the three situations. The maximum return is given by S3-B3, whereas the least by S2-B2. The reader can interpret this from the graph.
Final Thoughts
Moving averages are a trader’s handy tool just because of their simplicity. In reality, a trader plots two moving averages of different periods to predict the trend and direction of stocks. The knowledge of Moving Averages is crucial for new traders.


