

- In the last 14 days, the DOT crypto price has declined by 25.5%.
- The trading volume of the Polkdadot token has witnessed a good increase in the last 24 hours.
Polkadot is a network of blockchains that allows users to create and run their own blockchains with smart contracts and interoperability. DOT is the governance and staking token of Polkadot. Polkadot was founded by Ethereum co-founder Gavin Wood and the Web3 Foundation in 2016. DOT was redenominated in 2020.
The Polkadot crypto has a circulating supply of 1.265 Billion DOT with a total supply of 1.397 Billion DOT. Additionally, the maximum supply of the crypto is infinite and the fully diluted market cap of the crypto is $9.721 Billion.


Moreover, the all-time high price hit by the DOT crypto price is $54.98 and since then, the price has declined by 87%. Additionally, the all-time low price hit by the Polkadot token is $2.70 and the CMP of the crypto is 157% above this level.
The Polkadot token has witnessed a decline of 3.1% in its market cap resulting in a market cap value of $8.803 Billion. The ranking of the crypto is #12 in terms of market cap. Moreover, the trading volume of the crypto has increased by 35% in the last 24 hours.
Polkadot Derivatives Analysis
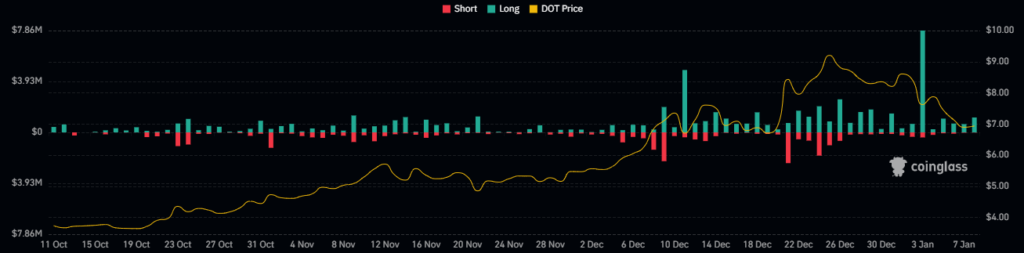
The reported long liquidation of the DOT crypto price in the last 24 hours is $1.75 Million and the short liquidation of the crypto is $45.94K. This shows that the sellers are currently winning over the price. The derivatives volume of the crypto has also declined by 77.58%, resulting in a traded volume of $519.41 Million.
DOT Crypto Technical Analysis

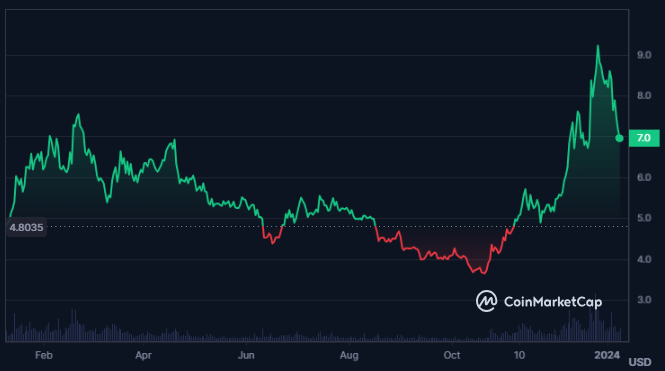
The DOT crypto price has a strong resistance and change of character level at $9.5 and the most recent swing is formed at the same level. The price of the DOT crypto failed to break above the crucial change of character level.
The DOT crypto price has declined by 30% from the most recent swing high, witnessing strong profit booking. If the price fails to break above the last swing high, a further decline in the price can be seen.
DOT/USD Chart by TradingView
After hitting the higher band of the Bollinger Band indicator, the trading price of the Polkadot crypto has declined below the median line.
The price of the crypto has also declined below the 50-day EMA and a golden cross pattern has been formed by the 50-day and the 200-day EMAs.
The RSI of the crypto has declined below the 50-level after hitting the overbought zones and is slowly declining to lower levels. The traders must stay cautious unless the RSI again rebounds above the 50-level.
Conclusion
Despite the recent drop in the DOT price, Polkadot remains a strong contender in the blockchain space. The indicators are giving a bullish signal in the daily timeframe while witnessing a decline in the shorter timeframe. If the crypto breaks above the level of $9.5, the price might continue to rise to higher levels.
Technical Levels
Support Levels: $3.600 and $6.400
Resistance levels:$13.400 and $23.60
Disclaimer
This article is for informational purposes only and does not provide any financial, investment, or other advice. The author or any people mentioned in this article are not responsible for any financial loss that may occur from investing in or trading. Please do your research before making any financial decisions.


