

- The trading volume of the DOGE crypto is witnessing a decline.
- The market cap of Dogecoin has increased by 1.19% in the last 24 hours.

Dogecoin is a meme-inspired cryptocurrency that was created by two software developers in 2013. It has a large and loyal fan base, including Elon Musk, who supports its use and adoption. Dogecoin’s value depends on supply and demand, as well as its integration into new products and services.
The circulating supply of the Dogecoin crypto is 142.673 Billion DOGE, which is similar to the total supply. Moreover, the max supply of Dogecoin is infinite and the fully diluted market cap of the crypto is $11.694 Billion.


The market cap of DOGE has increased by 1.03% in the last 24 hours and it is currently $11.685 Billion. Additionally, the current market cap ranking of the crypto is 10th. Furthermore, the value of the traded volume of the crypto is worth $295.71 Million.
The market cap dominance of Dogecoin is 0.66% and the volume/market cap ratio of the crypto is 0.0291. This means that 2.91% of the total market cap of the crypto was traded in the last 24 hours.
Dogecoin Derivatives Analysis
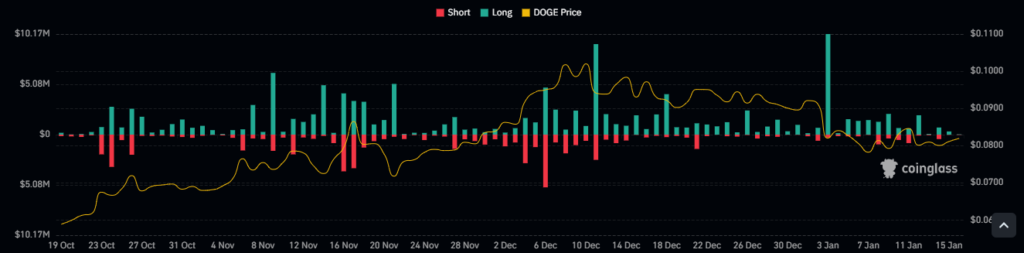
The trading volume of the Dogecoin crypto has declined by 21.73% in the last 24 hours. The traded value of the derivatives of the DOGE crypto is $475.10 Million. Moreover, the open interest of the crypto is flat, resulting in a value of $332.73 Million.
The long/short ratio of the DOGE crypto was 0.9798 in the last 24-hour. The long liquidation of the crypto is $350.15K and the short liquidation of the crypto is much less, resulting in a value of $65.16K.
DOGE Crypto Technical Analysis
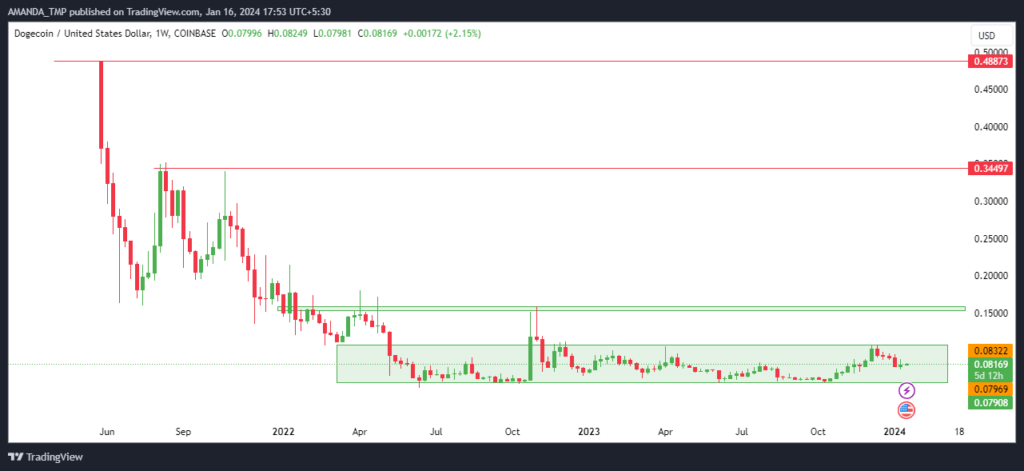
The chart reveals that Dogecoin has been in a downtrend since reaching a high of $0.1068 on December 21, 2023. The price has been making lower highs and lower lows, forming a descending channel pattern. The channel resistance has been tested several times, but the price has failed to break above it. The channel support has also been tested, but the price has bounced back from it.
DOGE/USD Chart by TradingView
The price is also below the 50-period and 200-day EMAs, which act as dynamic resistance levels. The moving average crossover, where the 50-day EMA crossed below the 200-day EMA, also confirmed the bearish trend.
The MACD is negative and is below the signal line, indicating a strong bearish momentum. The indicator has also formed bearish histograms on the daily chart of.
Summary
Dogecoin is a meme-based cryptocurrency that has a loyal fan-base and a large market cap. However, the price has been in a downtrend, as shown by the technical indicators and the chart pattern. The trading volume and the open interest have also declined. A trend reversal is uncertain at the moment.
Technical Levels
Support Levels: $0.5660 and $0.07600
Resistance levels:$0.34490 and $0.4880
Disclaimer
This article is for informational purposes only and does not provide any financial, investment, or other advice. The author or any people mentioned in this article are not responsible for any financial loss that may occur from investing in or trading. Please do your research before making any financial decisions.


