

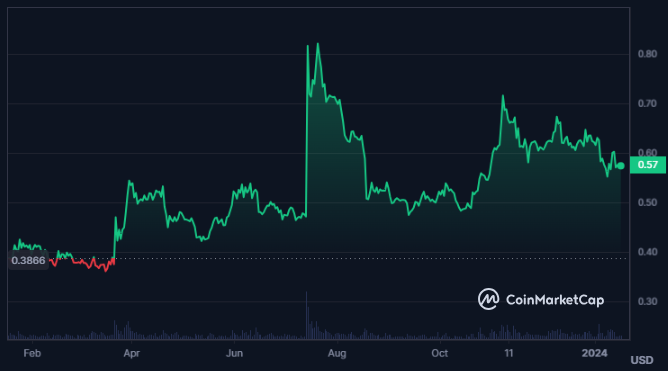
- In the last one year, the trading price of XRP crypto has advanced by 49.4%.
- XRP crypto is trading 21,354% above the all-time low price.
XRP is a cryptocurrency that aims to improve global payments. It was created by OpenCoin, later Ripple, and some influential crypto figures. Ripple develops and uses XRP through its RippleNet product, which connects financial institutions and provides liquidity. XRP is fast, green, and distributed.
The volume/market cap ratio of XRP is 2.98% and the market cap of the crypto is $31.146 Billion. Additionally, the trading volume of the crypto has declined by 17.3%, resulting in a traded volume of $928.018 Million in the last 24 hours.


The current circulating supply of XRP is 54.266 Billion which is 54.27% of the max supply. The max supply of the crypto is 100.0 Billion XRP and the fully diluted market cap of the crypto is $57.375 Billion.
As per Coingecko, the market cap ranking of XRP is 6th and the market cap dominance of the crypto is 1.763%.
XRP Crypto Derivatives Analysis
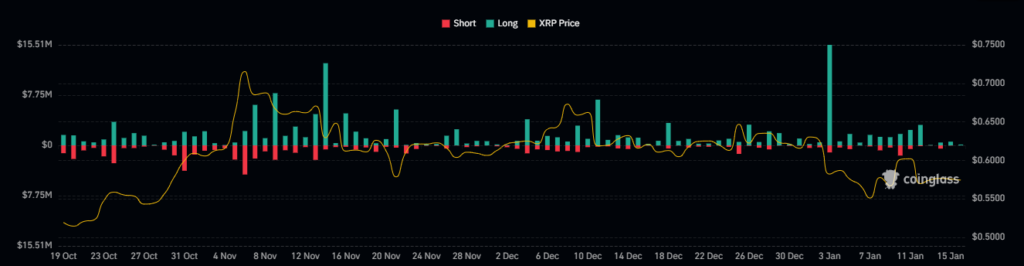
The long/short ratio of the XRP crypto is 0.9708 and the long liquidation of the crypto is $536.42K. The derivatives trading volume of the XRP crypto has declined by 28.8% and the open interest has advanced by 1.14%. Moreover, the current value of the open interest of the crypto is $534.37 Million.
XRP Crypto Technical Analysis

Following a strong trend, the XRP crypto price is trading inside a huge rising wedge pattern and the price of the price of the crypto is consistently revolving inside it.
One must wait for the price of the crypto to break in either direction before deciding any further trend possibility in the crypto price.
XRP/USD Chart by TradingView
The price is below the middle band of the Bollinger Bands, which indicates a bearish trend. The RSI is below 50 and falling steadily, which indicates weak bearish momentum. The MACD is below zero and formed a bearish cross, which indicates a downward trend.
However, the price has also formed a bullish divergence with the RSI and the MACD, which means that the price is making lower lows while the indicators are making higher lows.
This is a sign of a weakening downtrend and a potential reversal. The price has also bounced from the lower band of the Bollinger Bands, which acts as a dynamic support level.
Summary
XRP has gained over the last one year, volatility and competition. The technical analysis shows a downtrend, but also a possible reversal. The price may break out or break down depending on the market conditions.
Technical Levels
Support Levels: $0.4400 and $0.4800
Resistance levels: $0.5810 and $0.9500
Disclaimer
This article is for informational purposes only and does not provide any financial, investment, or other advice. The author or any people mentioned in this article are not responsible for any financial loss that may occur from investing in or trading. Please do your research before making any financial decisions.


