

- The options volume of Bitcoin has been witnessing a decline in the last 24 hours.
- In the last four months, the bitcoin price has increased by 70%.

Bitcoin is a decentralized cryptocurrency that uses blockchain technology to secure and verify transactions. It was created by a pseudonymous entity in 2008 and has a limited supply of 21 million coins. Bitcoin can be used for various purposes, such as payments, investments, or store of value.
The market cap of the Bitcoin crypto is $836.978 Billion and it is the world’s largest cryptocurrency with a market cap dominance of 47.375%. Moreover, the trading volume of the cryptocurrency has increased by 13.06% in the last 24 hours.


The traded volume value for Bitcoin in the last 24 hours is $23.909 Billion, which results in a volume/market cap ratio of 2.88%. The current circulating supply of the crypto is 19.6 Million BTC, which is 93.34% of the max supply.
Additionally, the max supply of Bitcoin is 21.0 Million BTC and it has a fully diluted market cap of $896.059 Billion.
The price of Bitcoin has increased by more than 69000% from its all-time low. Moreover, the price of the crypto is 38.10% below its all-time high, which was formed about two years ago.
Bitcoin Derivatives Analysis

With an increase of 2.18% in the options open interest, the options volume of Bitcoin has declined by 39.7%. This results in an increase of 14.13% in the derivatives volume in the last 24 hours.
Moreover, the long/short ratio for the BTC crypto is 0.9984. The recorded short liquidation for the crypto is worth $20.05 Million against the long liquidation of $15.54 Million.
BTC Crypto Technical Analysis
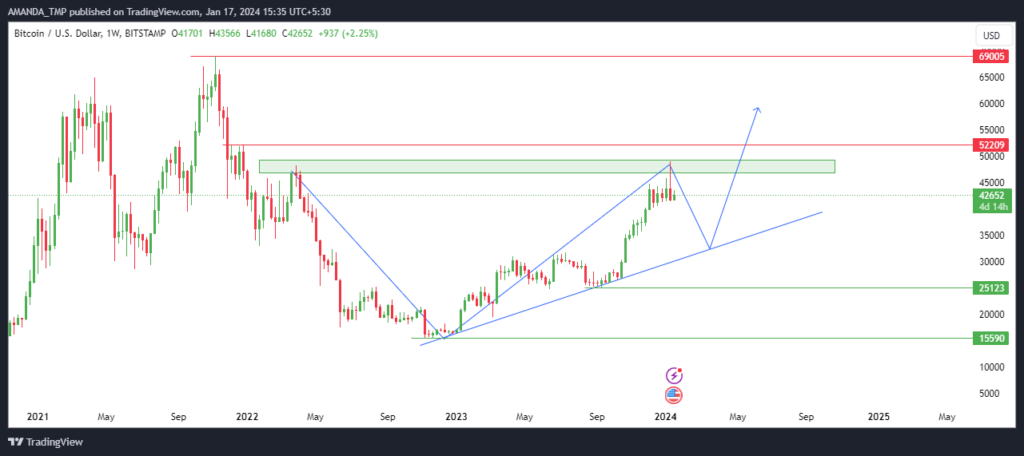
By taking support at the dynamic trendline on the larger timeframe, the price of the BTC crypto has been consistently rising to higher levels over the years. Looking at the most recent scenario, the price of the crypto is far from the dynamic trendline.
Additionally, there is a strong resistance at the level of $49185, which was recently hit a few days ago and the price is currently facing resistance at the same level.
Therefore, we can expect a small decline in the price in the upcoming days to the dynamic trendline before it resumes its rally toward new highs.
BTC/USD Chart by TradingView
The BTC crypto price is trading with the formation of a golden cross of the 20,50 and 200-day Exponential Moving Averages (EMAs) which led to a constant rise in the trading price.
The price of the Bitcoin crypto has recently broken below the 20-day EMA and is taking support at the 50-day EMA. If the price of the crypto further breaks below the 50-EMA, we might get to see further decline and retracement in the trading price of.
The MACD is in a declining phase as the MACD and the signal lines on the daily chart are forming a bearish cross and the values of the lines are consistently declining.
The RSI also represents a weakness in the momentum of the crypto as the value of the RSI has declined below the 50-level and the 14-day SMA.
Summary
Bitcoin’s market cap and trading volume are high, but its price is below its peak. Its options volume is declining, and its technical indicators suggest a possible drop before a new rally.
Therefore, we might witness a decline in the price in the upcoming days if indicators continue to support the bearish signals.
Disclaimer
This article is for informational purposes only and does not provide any financial, investment, or other advice. The author or any people mentioned in this article are not responsible for any financial loss that may occur from investing in or trading. Please do your research before making any financial decisions.


