

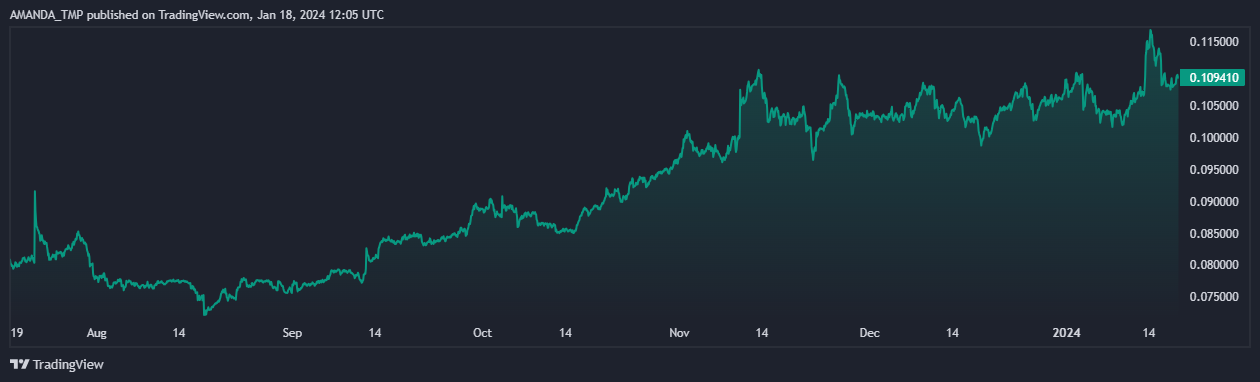
- The TRX crypto price has increased by 77% in the last year.
- As per Coingecko, the TRX token’s current market cap ranking is #12.
Tron is a blockchain platform that aims to create a decentralized internet. It has its own cryptocurrency, TRX, which is used for fees, staking, and governance. It supports smart contracts, DApps, DeFi, and stablecoins. It was founded by H.E. Justin Sun, who also acquired BitTorrent.
As per Coinglass, Tron has faced a long liquidation of $18.73K against which the short liquidation is worth only $4.89K. The spot trading volume of the crypto has declined by 11.11% along with a decline of 21.9% in the derivatives trading volume.


The market cap of the crypto is showing a flat change of 0.2% in the last 24 hours with a market cap of $9.64 Billion. Additionally, the volume/market cap ratio of the crypto is 2.34%.
Tron’s market cap dominance is 0.55% and the volume/market cap ratio of the crypto is 0.0403. The open interest of the crypto has declined by 1.24% in the last 24 hours, resulting in a long/short ratio of 0.9474.
Tron Token Data Overview
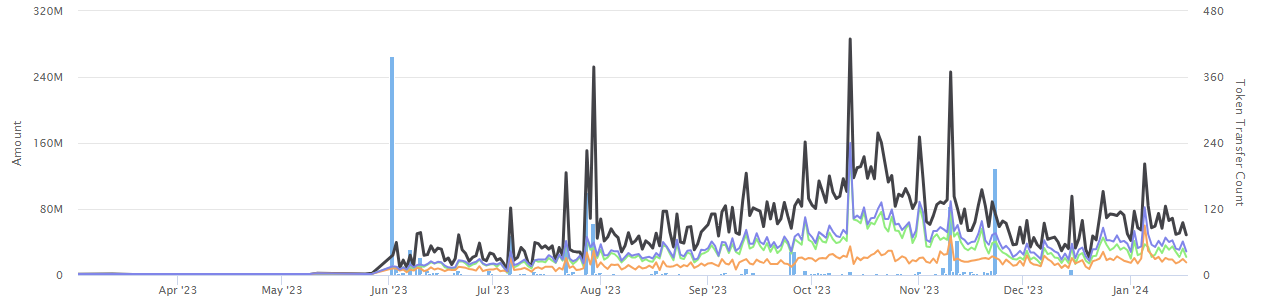
The Tron token has a total of 5,109 holders and the total number of transfers recorded, as per Etherscan.io, is 22.1K. It has a circulating supply of 88.212 Billion TRX and the max supply of the crypto is infinite.
TRX Crypto Technical Analysis
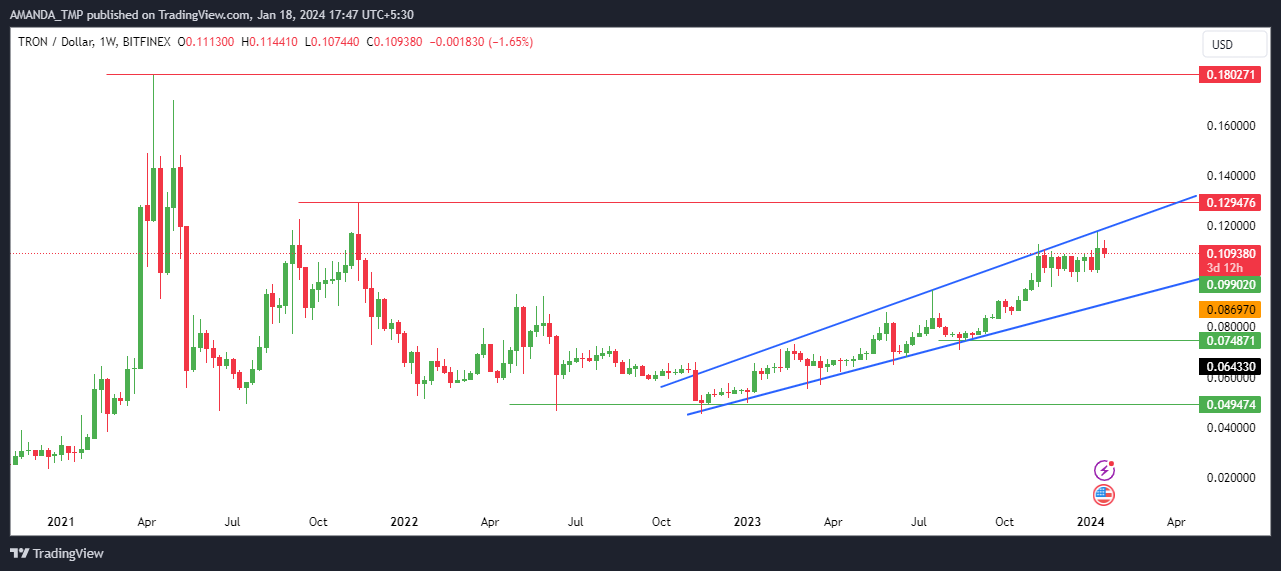
The TRX crypto is trading inside a rising wedge pattern for a very long time and has hit the upper band of the pattern recently. The possibility of the price retracing back to the lower band is high. Despite this, if the price breaks above the wedge pattern, we might witness a huge surge in the price.
TRX/USD Chart by TradingView.com
The TRX crypto price is consistently rising to higher levels leading to bullish signals from the technical indicators.
The 20, 50 and 200-day EMAs are consistently rising to higher levels and have formed a golden cross on the daily chart. The price of the crypto is also following the same pattern, and it is situated above the EMAs, indicating a strong presence of buyers.
The MACD has also formed bullish histograms on the chart and the MACD and the signal lines are forming a bullish cross.
The RSI is also pointing to bullish momentum as it is situated above the 50-level and also above the 14-day SMA. This behavior of the RSI indicates strength in the price momentum.
Summary
The TRX price has risen by 77% in a year and is trading within a rising wedge pattern. The technical indicators show a bullish trend and point to a potential breakout above the wedge.
Therefore, if the price of the TRX crypto breaks above the rising wedge pattern, we can see further increases in the price.
Disclaimer
This article is for informational purposes only and does not provide any financial, investment, or other advice. The author or any people mentioned in this article are not responsible for any financial loss that may occur from investing in or trading. Please do your research before making any financial decisions.


