

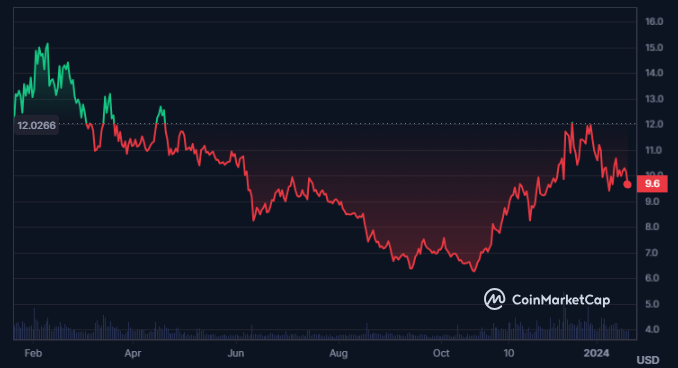
- Cosmos has witnessed a slight rise in its trading volume.
- The ATOM crypto is trading in a downtrend and has declined by 8.4% in the last 30 days.
Cosmos is a decentralized network of interoperable blockchains, aiming to create an “Internet of Blockchains”. ATOM is its native cryptocurrency, used for fees, staking, rewards, and governance. Cosmos was created by the Interchain Foundation, a non-profit organization with a vision of an open and permissionless blockchain ecosystem.
The Cosmos crypto has faced a decline of 5.8% in its market cap in the last 24 hours and the current market cap value of the crypto is $3.692 Billion. Additionally, the crypto’s market cap ranking as per CoinMarketCap is #23.


The trading volume for the Cosmos crypto has Increased by 16.1% with a traded volume worth $137.45 Million, in the last 24 hours. Moreover, the volume/market cap ratio of the crypto is 3.71%.
The crypto has a fully diluted market cap of $3.694 Billion along with a circulating supply of 383.346M ATOM. Additionally, the total supply of the crypto is similar to the circulating supply while the max supply of the crypto is infinite.
Cosmos Crypto Derivatives Analysis
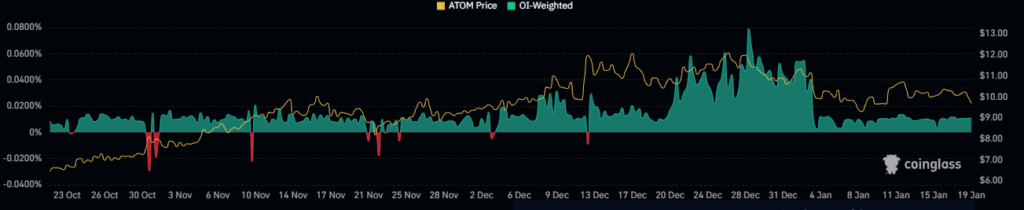
The long/short ratio of the Cosmos crypto is 0.9467 and the derivatives trading volume of the crypto has increased by 31.3% in the last 24 hours. Despite the rise in the trading volume, the open interest of the crypto has declined by 6.5%.
Cosmos has witnessed higher long liquidation in the last 24 hours, indicating the dominance of sellers in the market. Moreover, the reported long liquidation for the crypto is $613.50K and the short liquidation for the crypto is $14.92K.
ATOM Crypto Technical Analysis
The ATOM crypto price is trading inside a declining channel and the price of the crypto is slightly declining to a lower level. The price of the ATOM crypto is also forming bearish candlesticks on the chart.
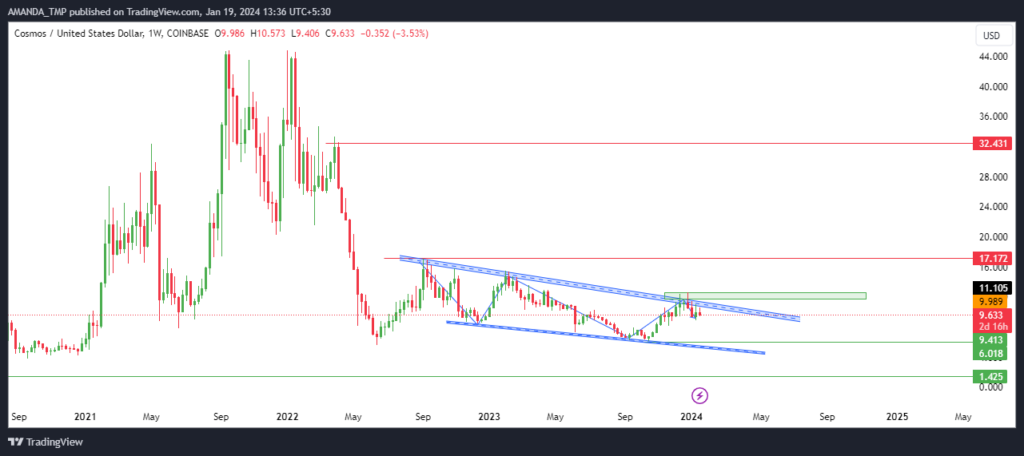
The current behavior of the crypto price shows that the price might lead to a lower band of the falling wedge pattern on the weekly charts.
ATOM/USD Chart by TradingView
The indicators on the daily timeframe chart of the ATOM crypto also show weakness in the price and are giving a sell signal.
The 50-day and the 200-day EMAs are forming a golden cross while the price of the crypto has declined below the 20 and the 50-day EMAs and is currently taking support at the 200-day EMA.
The MACD and the signal lines are forming a bearish cross below the zero level. The indicator also is forming bearish histograms on the charts indicating an increase in bearish volume for the crypto.
The RSI value has declined below the 14-day SMA and the 50-level, indicating a loss in the bullish momentum of the crypto. If the RSI fails to rebound above the 50 level, the price of the crypto might continue to decline to lower levels.
Summary
ATOM is facing a downtrend and a low trading volume. The technical indicators suggest a bearish outlook for the crypto, as it trades below key resistance levels and shows weak momentum. ATOM is unlikely to double its value soon if the price of the crypto breaks above the wedge pattern and the swing highs.
Disclaimer
This article is for informational purposes only and does not provide any financial, investment, or other advice. The author or any people mentioned in this article are not responsible for any financial loss that may occur from investing in or trading. Please do your research before making any financial decisions.


