

- Aptos uses a different kind of hashing algorithm known as KECCA_256.
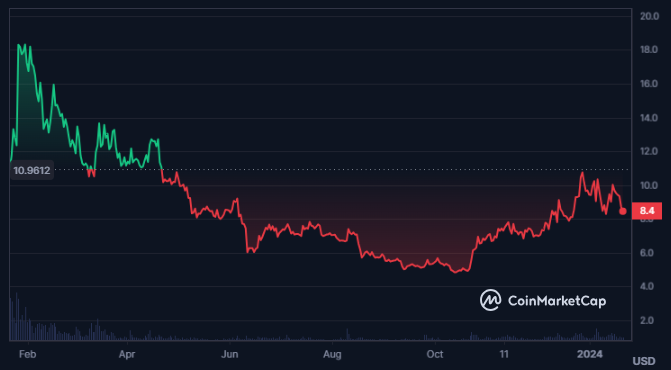
- APT crypto price has declined by 57.7% from its all-time high price.
APT is the native token of Aptos, a Layer-1 blockchain that uses Move, parallel processing, and AptosBFT consensus. APT is used for fees, staking, and governance. Aptos Labs, founded by former Meta engineers, created Aptos in 2021.
The market cap of Aptos declined by 2.06% in the last 24 hours, following a decline of 25.21% in the trading volume. Moreover, the volume/market cap ratio of the crypto is 6.27%.


The current market cap value of the crypto is $2.843 Billion which makes it the 31st largest cryptocurrency. Moreover, the value of the traded volume for the crypto in the last 24 hours is $173.197 Million
Moreover, the current circulating supply of the Aptos is 335.702 Million APT and the total supply of the crypto is 1.076 Billion APT. Moreover, the max supply of the crypto is infinite while the fully diluted market cap of the crypto is $9.109 Billion.
Aptos Crypto Derivatives Analysis
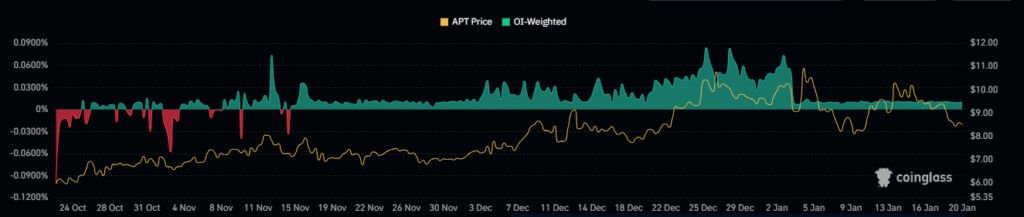
The short liquidation for the Aptos crypto is $49.68K against the long liquidation of $476.43K. The long/short ratio of the crypto is 0.8737, highlighting sellers’ dominance. The derivatives volume of the crypto has declined by 29.1% in the last 24 hours.
Furthermore, the open interest of the crypto has declined by 4.85% resulting in $87.41 Million.
APT Crypto Technical Analysis

The APT crypto price is trading in a bullish market structure leading the price to higher levels. Moreover, the price of the APT crypto is hovering at a crucial resistance level. If the price of the crypto manages to sustain above the breakout level, we might witness further advances in the trading price of the crypto.
APT/USD Chart by TradingView
Although the EMAs are following a golden cross on the daily chart of the APT crypto, the price has declined below the 20-Day and the 50-Day EMA indicating weakness in the price.
The price of the crypto currently is trading between the 50-Day and the 200-Day EMAs. If the price rebounds above the 50-Day EMA, the uptrend is likely to continue.
The MACD further is declining towards the lower levels. Bearish histograms are formed on the chart and the MACD and the signal line are trading in a bearish cross indicating a sell signal.
The RSI on the daily chart of APT crypto is declining from the overbought zones and is currently trading at the level of 44.01. It also has declined below the 14-Day SMA which is currently trading at 49.26 indicating selling pressure in the crypto.
Summary
The Aptos crypto price has plummeted by 57.7% from its peak and shows signs of weakness. The trading volume, open interest, and long/short ratio are dropping. The technical indicators are bearish. Therefore, the crypto price might further decline in the crypto price if it fails to rebound above the previous swing high.
Disclaimer
This article is for informational purposes only and does not provide any financial, investment, or other advice. The author or any people mentioned in this article are not responsible for any financial loss that may occur from investing in or trading. Please do your research before making any financial decisions.


