

- Ethereum crypto has given a return of 59.7% to its investors in the last year.
- The ETH crypto has a market cap dominance of 18.2%.

Ethereum is a blockchain platform for smart contracts and dApps. ETH is a cryptocurrency that has value and utility. Ethereum supports various applications, tokens, and communities. The Merge was an upgrade that switched Ethereum to PoS, improving its efficiency, security, scalability, decentralization, and evolution.
Ethereum has a market cap worth $297.288 Billion which makes it the second-largest cryptocurrency in the global cryptocurrency market. The traded volume value for the Ethereum has declined by 14.7% in the last 24 hours.


The volume/market cap ratio of the Ethereum crypto is 3.50% and the derivatives trading volume for the crypto has declined by 17.49% in the last 24 hours. The value of the traded volume for the ETH crypto is $18.39 Billion.
The crypto is trading with a long/short ratio of 0.9822 and the open interest for Ethereum declined 1.57%, following which, the options volume has also declined by 51.5%.
The current option’s open interest for the crypto is $6.38 Billion followed by the derivatives open interest of $8.67 Billion. Moreover, a strong conflict between buyers and sellers can be seen as the long liquidation for the crypto is slightly higher than the short liquidation.
Ethereum Blockchain Data
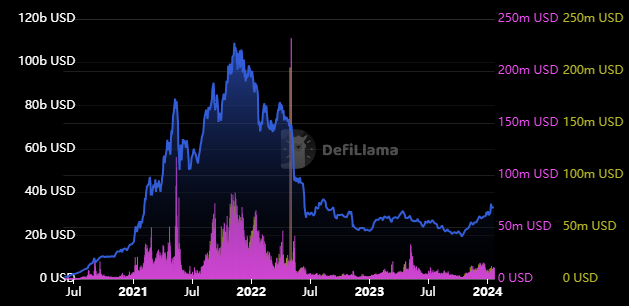
Ethereum has a Stablecoins market cap of $71.512 Billion and the recorded fees for the crypto in the last 24 hours is $10.22 Million. Moreover, the reported total inflows for Ethereum are worth $25.08 Million and a treasury of $773.8 Million.
The circulating supply of the crypto is 120.175 Million ETH and the total supply of the crypto is also the same. Moreover, the max supply of Ethereum is infinite followed by a fully diluted market cap of $297.115 Billion.
ETH Crypto Technical Analysis
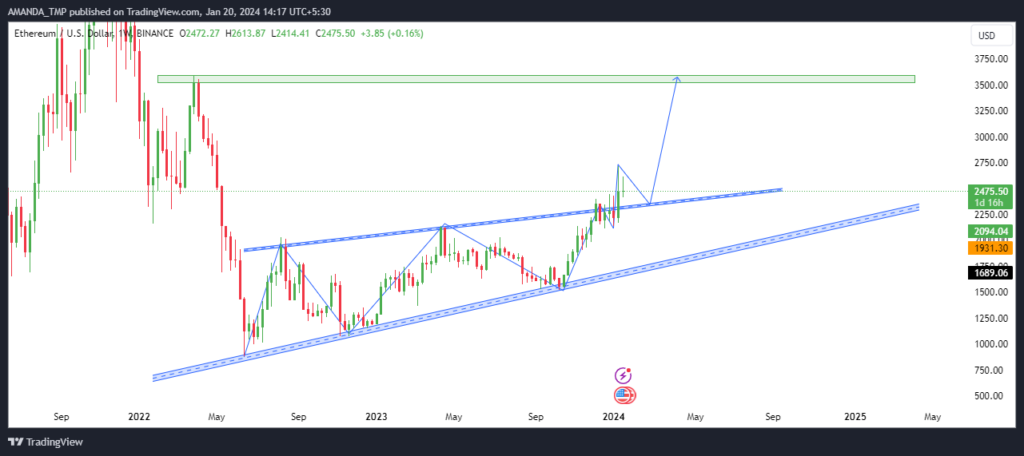
Ethereum crypto price has been consistently advancing to higher levels which led to the formation of a rising wedge pattern. The price of the crypto recently broke above the same.
Currently, the price of the crypto is sustaining above the same and forming a bullish candlestick pattern. This behavior of the price shows buyers’ dominance and the price of the crypto might lead to higher levels.
ETH/USD Chart by TradingView
Followed by the bullish price action, the technical indicators are also giving bullish signals on the lower timeframe.
The RSI following a bullish cycle is consistently sustaining above the 50-level indicating strength in the momentum of the crypto price.
The MACD and the signal line trading above the zero level followed by a bullish cross indicate the presence of buying sentiment in the crypto price.
The moving averages such as the 20-Day period and the 50-Day period are rising steadily and the 50-Day and the 200-Day EMAs are trading in a golden cross. The price of the ETH crypto is also trading above all the EMAs indicating strength in the price.
Summary
Ethereum has a strong market position and technical indicators are giving a strong buy signal. The market structure on the larger timeframes for the ETH is also bullish followed by a strong breakout. Ethereum is bullish and may rally in the upcoming days.
Disclaimer
This article is for informational purposes only and does not provide any financial, investment, or other advice. The author or any people mentioned in this article are not responsible for any financial loss that may occur from investing in or trading. Please do your research before making any financial decisions.


