

- As per CoinCodex, Telcoin is showing high supply inflation.
- The TEL crypto price is down by 98% from its all-time high trading price.
Telcoin is a DeFi platform that uses TEL, a token based on Ethereum. TEL is used for paying fees, staking, earning, exchanging, and voting on the platform. TEL allows users to access various decentralized financial products.
Telcoin is trading at a current market price of $0.001213 at the time of writing and it has increased by 6.07% in the last 24 hours. The current market cap value of the crypto is #331 as per CoinMarketCap.


The current market cap value of the crypto is $104.547 Million and the trading volume of Telcoin is flat, showing only a slight increase of 1.2% in the last 24 hours. Additionally, the volume/market cap ratio of the crypto is 0.41%.
The volatility of the crypto price is also high and is reported to be 8.49% by CoinCodex. Moreover, the sentiment of the crypto is also bearish and the fear and greed index is at 55, indicating greed in the investors.
Tecloin is built on the Ethereum platform and uses the ERC20 token standard. The crypto was launched on December 12, 2017. The price of the crypto has declined by 98.1% from its all-time high price.
Telcoin Token Overview

The max supply and the total supply of the Telcoin crypto are the same at 100.0 Billion TEL and it has a circulating supply of 86.149 Billion TEL.
The fully diluted market cap of the crypto is $121.427 Billion and it has a total of 45.13K holders, as per Etherscan.io. The circulating supply market cap of the crypto is $94.305 Million.
Moreover, the recorded liquidity for Telcoin is worth $3.77 Million as per DefiLlama and the total amount raised by the crypto is $10.0 Million.
TEL Crypto Technical Analysis

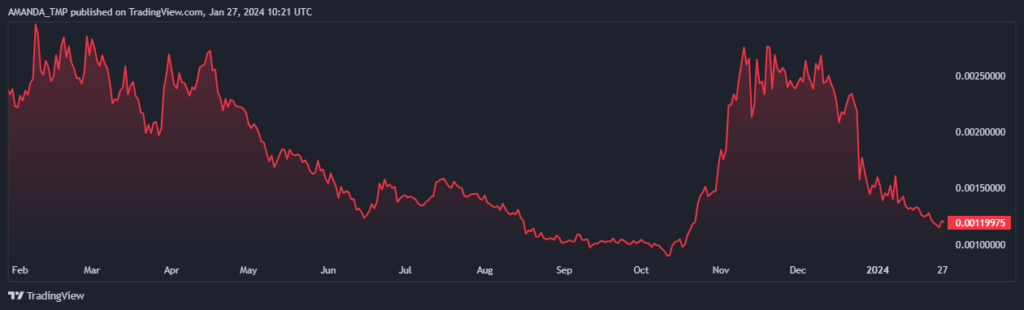
The TEL crypto is trading inside a small range, facing resistance and support from the higher and lower bands which has resulted in the formation of a falling wedge pattern.
Looking at the most recent price action of the crypto, we can expect a further decline in the price of the crypto as it is forming a bearish candlestick pattern on the chart. The price of the TEL crypto also is close to the lower band of the channel.
TEL/USD Chart by TradingView
On the lower timeframe, the indicators on the daily chart of the TEL crypto can be seen giving bearish signals.
The MACD and the signal lines are forming a bearish cross below the zero level and there is the formation of the small and weak green histogram formations on the chart.
The EMAs are forming a death cross and the price of the crypto is also declining below the EMAs. For instance, the price of the crypto on the daily timeframe has declined below the crucial EMAs such as the 20, 50, and 200-day EMAs.
The RSI is at 37.2 and is overlapping with the 14-day SMA, indicating bearish to uncertain momentum in the crypto price.
Summary
The TEL crypto price is down by 98% from its all-time high and has low trading volume and market cap. The technical analysis shows a falling wedge pattern and bearish indicators. In short, Telcoin is facing a high risk of further price declines.
Disclaimer
This article is for informational purposes only and does not provide any financial, investment, or other advice. The author or any people mentioned in this article are not responsible for any financial loss that may occur from investing in or trading. Please do your research before making any financial decisions.


