

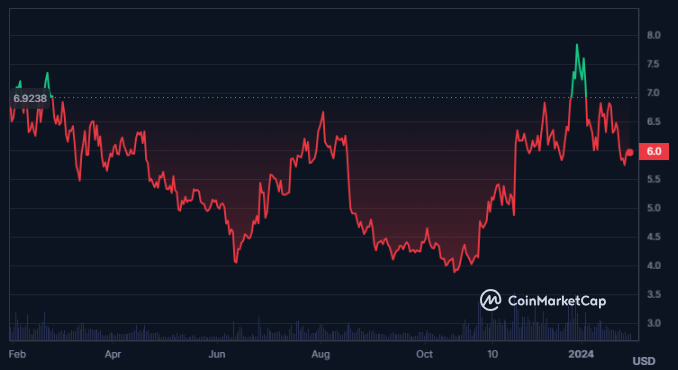
- In the last 24 hours, the price of the UNI crypto has declined by 0.4%.
- The Uniswap crypto was released on September 16, 2020, for the first time.
Uniswap is a decentralized exchange protocol that allows users to trade Ethereum-based tokens without intermediaries. UNI is its governance token that enables the community to influence the platform’s development and receive various benefits. UNI was created by the Uniswap team, led by Hayden Adams, in September 2020.
The trading volume of the Uniswap crypto has increased by 25% in the last 24 hours, resulting in a traded volume of $65.706 Million. Additionally, the market cap of the crypto has declined by 0.4% and the current market cap ranking of the crypto is #23.


The fully diluted market cap of the Uniswap crypto is $5.959 Billion and the market cap of the crypto is $3.569 Billion. Moreover, the TVL of the crypto is $4.104 Billion while the market cap/TVL ratio of the crypto is 0.8711661.
The circulating supply of the crypto is 598.187 Million UNI, which is 59.8% of the max supply that comes up to 1.0 Billion UNI. Moreover, the current market cap dominance of the crypto is 0.22%.
Uniswap Derivatives Analysis
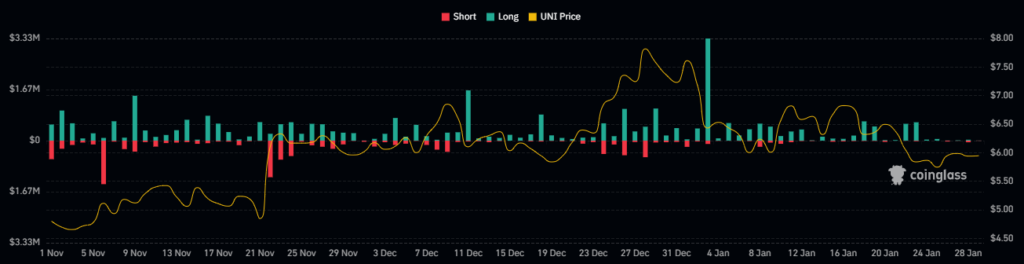
The derivatives open interest has declined by 0.34% in the last 24 hours while the trading volume has increased by 25.1%. Additionally, the traded volume value of the derivatives is $66.20 Million.
The long/short ratio of the crypto is 0.9448 and the long liquidation for the crypto in the last 24 hours is $29.0K. Furthermore, the short liquidation for the crypto is $7.81K, which shows the dominance of sellers.
UNI Crypto Technical Analysis
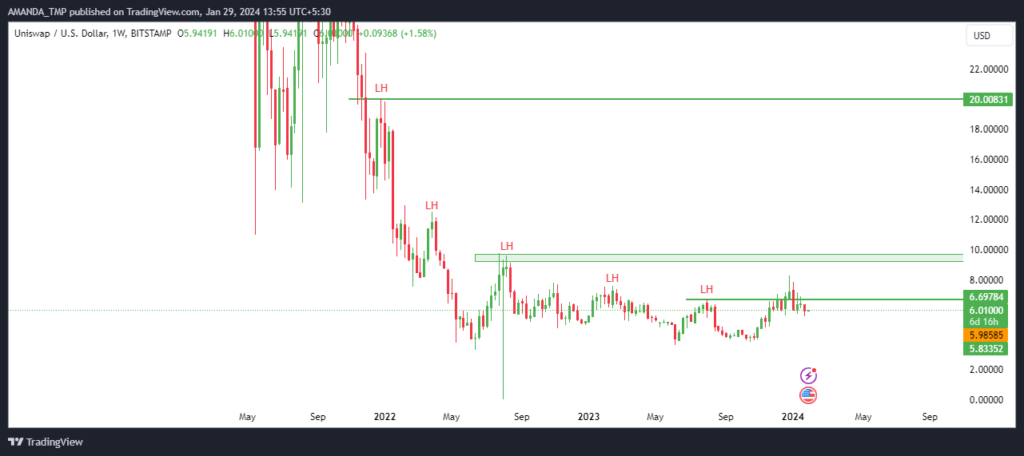
The trading price of the Uniswap crypto has formed consistent lower lows on the chart, indicating a strong downtrend. The price of the crypto is still below the previous swing highs and it hasn’t been able to sustain above the last swing high.
Moreover, the Uniswap crypto has a very crucial resistance at a level of $9.80 and if the price of the crypto breaks above this level, we might witness a change in trend to bullish.
UNI/USD Chart by TradingView
The UNI crypto is trading above the 200-day EMA while the 50-day and the 200-day EMAs are forming a golden cross. Despite this, the trading price of the crypto has declined below the 20-day and the 50-day EMAs.
If the price of the crypto manages to sustain above the 200-day EMA and breaks above the 50-day EMA, we might witness even higher levels in the crypto price.
The MACD line is situated below the signal line, declining below the zero level. Additionally, the indicator is forming bearish histograms on the chart.
The RSI is currently undergoing a bullish cycle, despite its value dipping below the 50 level. Notably, the RSI has fallen beneath both the 14-day SMA and its previous levels, aligning with the downward trajectory of the cryptocurrency’s price as it descends to lower levels.
Summary
The UNI crypto is in a strong downtrend, trading below the key resistance of $9.80 and the 50-day EMA. The derivatives data shows more sellers than buyers, and the technical indicators are bearish. The UNI crypto does not support the supply inflation and may face further downside pressure.
Disclaimer
This article is for informational purposes only and does not provide any financial, investment, or other advice. The author or any people mentioned in this article are not responsible for any financial loss that may occur from investing in or trading. Please do your research before making any financial decisions.


