- The open interest of ADA is consistently declining.
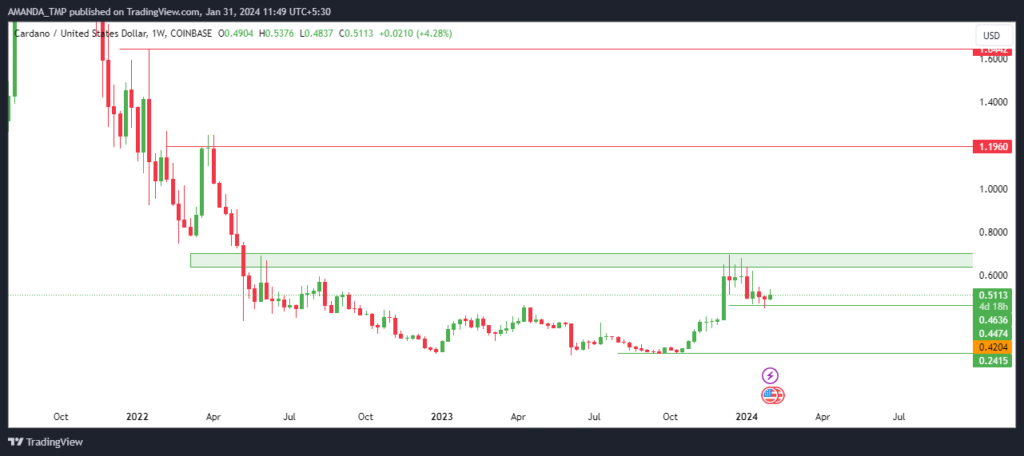
- The ADA crypto price is trading in a small range and it is consolidating in a dynamic range.

Cardano is a PoS blockchain platform that supports smart contracts and dApps. It was created by Ethereum co-founder Hoskinson and others. It uses Ouroboros, a research-based consensus mechanism, and has different eras of development. ADA is its native token which is used for fees, rewards, and governance.
The open interest and the trading volume of the Cardano crypto is consistently declining over time. The derivatives trading volume has witnessed a decline of 19.08% while the options volume has declined by 92.9% in the last 24 hours.
Furthermore, the market cap of the crypto has declined by 3.2% in the last 24 hours, resulting in a value of $18.126 Billion. Its global market cap ranking is 8th as per CoinMarketCap.
The spot trading volume of the Cardano crypto has declined by 11.55% in the last 24 hours, reaching a value of $453.178 Million. Additionally, the volume/market cap ratio of the crypto is 2.53%.
The Cardano token has a circulating supply of 35.453 Billion ADA which is 78.72% and the max supply which is 45.0 Billion ADA. Additionally, the total supply of the crypto is 36.585 Billion ADA and the fully diluted market cap of the crypto is $22.98 Billion.
Cardano Derivatives Analysis

Source: Coinglass
The long/short ratio of the Cardano crypto is 0.9589 and the long liquidation recorded by the crypto is worth $953.13K.
The derivatives volume traded in the last 24 hours is worth $555.26 Million and the open interest of the crypto comes up to $297.46 Million.
ADA Crypto Technical Analysis

After a surge of 190% in the price from the most recent lows, the ADA price is currently taking a pause at higher levels and has created a strong resistance level.
If the price of the ADA crypto breaks above the last swing high of $0.71, the price might further rise to higher levels.
ADA/USD Chart by TradingView
The EMAs indicate a strong uptrend as the 50-day and the 200-day EMAs are forming a golden cross while the price is currently taking support at the 50-day EMA.
The MACD, on the other hand, shows some weakness as the MACD and the signal lines are both situated below the zero level. Despite this, the MACD line is above the signal line which indicates the possibility of a bounce in the price.
The RSI is declining from the overbought zones below the 50-level and it is now trying to rebound as it has broken above the 14-day SMA.
Summary
If the Cardano token price breaks out of the consolidation phase, we might get to see a resumption in its uptrend as the price rises to higher levels. The technical indicators suggest a bullish reversal and a potential rally to new highs.
Disclaimer
This article is for informational purposes only and does not provide any financial, investment, or other advice. The author or any people mentioned in this article are not responsible for any financial loss that may occur from investing in or trading. Please do your research before making any financial decisions.


