

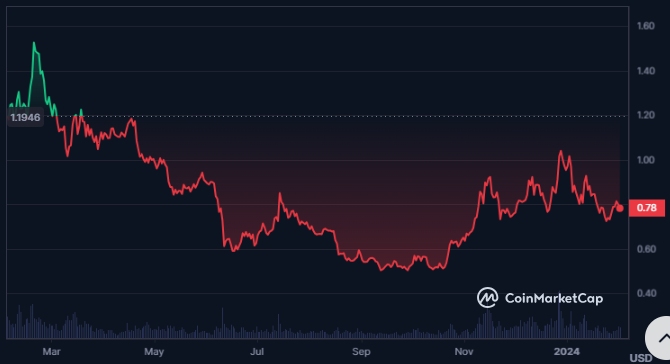
- The Polygon crypto is witnessing a decline in its trading volume.
- The MATIC crypto price has increased by more than 25700% from its all-time low.
Polygon is a Layer-2 solution for Ethereum that enables faster and cheaper transactions with its token, MATIC. It was founded by four Ethereum developers in 2017 and hosts many DeFi applications. MATIC is used for fees, governance, and staking on the network.
The market cap of the Polygon crypto is $7.527 Billion and it is the 14th largest crypto globally in terms of market cap. The fully diluted market cap of the crypto is $7.833 Billion and the max supply is 10.0 Billion MATIC which is the same as its total supply.


The market cap of MATIC has witnessed a decline of 4.86% in the last 24 hours and on the other hand, the trading volume has increased by 4.16%. The value of the traded volume for the crypto is $410.277 Million.
The volume/market cap ratio of the Polygon crypto is 5.50% and the circulating supply is 9.610 Billion MATIC. Additionally, the market cap dominance of the crypto is 0.39% while the volatility is 7.52%.
Polygon Derivatives Analysis

The long/short ratio of the Polygon crypto is 0.9387 and the derivatives trading volume of the crypto has increased by 35.25%. This has resulted in a traded volume value of $741.39 Million.
Additionally, the open interest of the crypto has declined by 7.2% and the Polygon crypto has witnessed a long liquidation of $1.61 Million against the short liquidation of $99.32K.
MATIC Crypto Technical Analysis
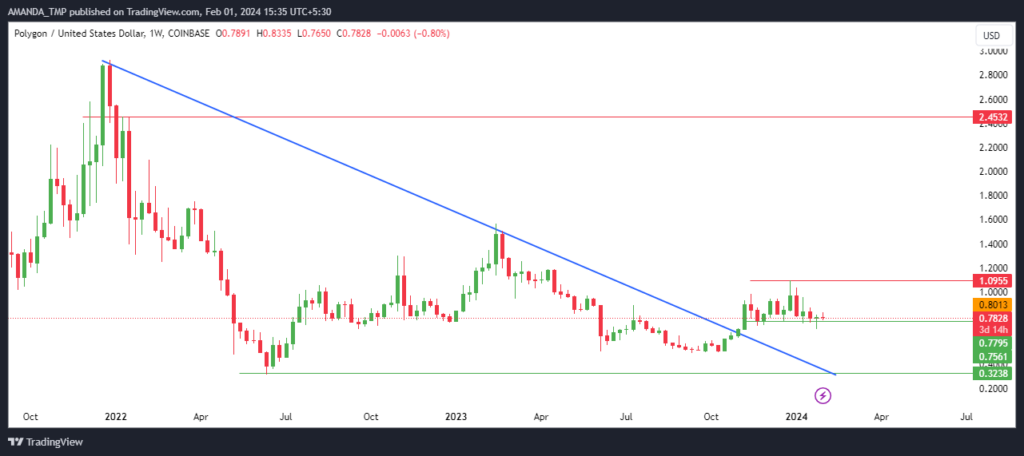
The subtle decline in the price of the crypto led to the formation of the descending triangle pattern and the MATIC price broke out above the pattern.
Currently, the price of the MATIC crypto is hovering in a small zone and the price is accumulating after the breakout. If the price of the crypto further breaks above the high of the last swing, we might witness further increases in the price.
MATIC/USD Chart by TradingView
The 50-day and the 200-day EMAs are forming a golden cross while the price is taking support at the 200-day EMA. Despite this, the price has declined below the 50-day EMA which might act as a hurdle for the breakout of the price.
The MACD is giving a sell signal as the MACD and the signal lines are situated below the zero level.
The RSI is showing mild weakness in the momentum of the price as it has declined below the 50-level. Despite this, it is situated above the 14-day SMA which indicates the possibility of a bullish reversal.
Summary
The MATIC crypto price has soared by over 25000% from its all-time low and is ready to break new highs. The technical indicators are mostly bullish and the price is supported by the 200-day EMA. Therefore, it is probable that the price of MATIC will rise in the coming days.
Disclaimer
This article is for informational purposes only and does not provide any financial, investment, or other advice. The author or any people mentioned in this article are not responsible for any financial loss that may occur from investing in or trading. Please do your research before making any financial decisions.


