

- In the period of the last 30 trading days, XRP crypto has shown only 13 positive trading days.
- Technical indicators are giving a sell signal for the XRP crypto.
Ripple is a fintech company that offers a global payment solution using its network (RippleNet) and ledger (XRPL). XRPL uses XRP as its native token along with a consensus algorithm to validate transactions. Ripple aims to be a mediator and a fast remittance service for different currencies.
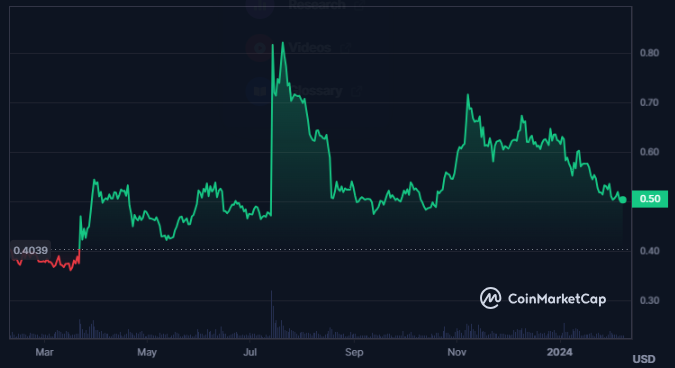
The XRP crypto is trading at a level of $0.5033, witnessing a decline of 0.41% in the last 24 hours. The market cap value of the crypto is $27.398 Billion. Moreover, the market cap ranking of XRP is 6th, as per CoinMarketCap.


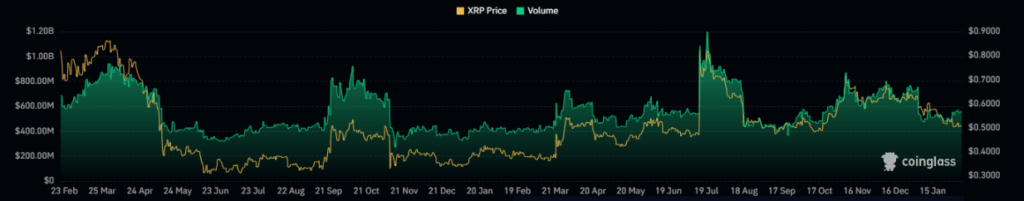
The trading volume of the XRP crypto has increased by 4.7%, resulting in a value of $825.581 Million. The volume/market cap ratio of the crypto is 2.87%.
The total supply of the crypto is 99.987 Billion XRP and the max supply is 100.0 Billion XRP. Moreover, the circulating supply is 54.436 Billion XRP and the fully diluted market cap is $50.243 Billion.
The supply inflation of the crypto is relatively high at 8.31% and the market cap dominance of the crypto is 1.65%. The volatility of the crypto is also high and is currently 5.5%.
XRP Crypto Derivatives Analysis
The options volume of XRP has declined by 46.5% in the last 24 hours and there has been an increase of 15% in options open interest. The derivatives trading volume has further witnessed a decline of 1.05%.
The long/short ratio for the crypto is 0.9818 and the long liquidation for the crypto is worth $184.1K against the short liquidation of $125.81K.
XRP Crypto Technical Analysis
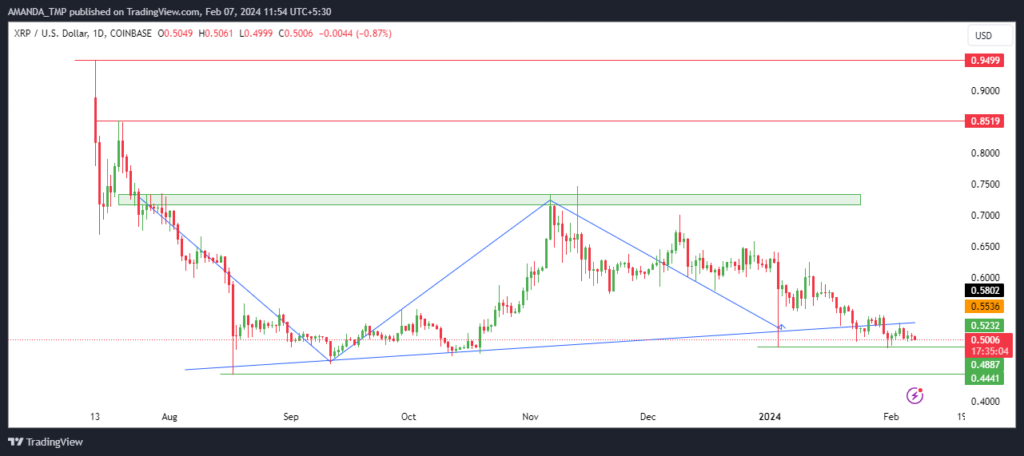
The trading price of the crypto has declined below the dynamic trendline and shows a very strong downtrend. The Ripple crypto price has been consistently declining for a long time and has lost its value by more than 85% from its all-time high price.
The price of the crypto is declining along with the decline of the 20, 50 and the 200-day moving averages, indicating a downtrend. The crypto has recently completed the formation of 200 candles on the given daily chart, which led to the formation of the 200-day EMA.
XRP/USD Chart by TradingView
The MACD and the signal lines overlap each other and have formed small histogram blocks on the chart. This behavior of the indicator shows weakness and uncertainty in the price.
The RSI is situated below the 50-level and is currently at 35.93. The 14-day SMA overlaps the RSI line and the RSI is following a bearish cycle.
Summary
XRP has been in a downtrend for a long time and faces legal challenges from the SEC. The technical indicators suggest a bearish outlook for XRP, as it trades below the moving averages and the RSI is also indicating weakness at the moment.
Disclaimer
This article is for informational purposes only and does not provide any financial, investment, or other advice. The author or any people mentioned in this article are not responsible for any financial loss that may occur from investing in or trading. Please do your research before making any financial decisions.


