

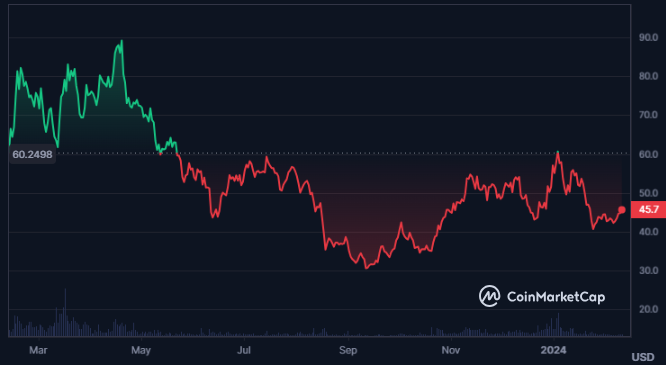
- The volatility of the GMX crypto is very high resulting in 10.11%.
- The crypto price has lost its value by more than 49% from its all-time high price.
GMX is a platform that allows users to trade spot and perpetual contracts on Ethereum and Avalanche, with low fees and high liquidity. GMX token is used for governance, rewards, staking, and vesting. GMX was launched in 2021 and its founders are unknown.
The GMX crypto seems to be facing positivity as the market cap of the crypto has advanced by 1.7% in the last 24 hours. Moreover, the market cap value of the crypto is $430.352 Million.


GMX token has a market cap ranking of 125th as per CoinMarketCap and the fully diluted market cap of the crypto is $444.474 Million. Moreover, the trading volume for the token has declined by 15.3% resulting in a traded volume value of $11.498 Million.
The volume/market cap ratio of the crypto is 3.36% and the circulating supply of the crypto is 9.424M GMX. Also, the total supply of the crypto is 9.736 Million GMX and the max supply of the crypto is infinite.
Moreover, the market cap dominance of the crypto is 0.02% and the sentiment of the crypto is bearish. The fear and greed index of the crypto is at 74 indicating greed and the supply inflation of the crypto is also high resulting in 17.95%.
GMX Crypto Derivatives Analysis
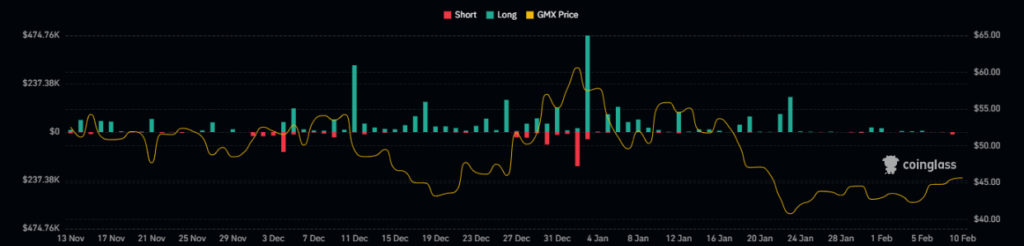
The long liquidation for the crypto is nill as per Coinglass while the short liquidation for the crypto is $10.35K. This represents the strong dominance of buyers over the last 24 hours.
The derivatives trading volume of the crypto has further declined by 22.6% resulting in $10.89 Million and the open interest of the crypto has declined by 1.58%.
GMX Crypto Technical Analysis
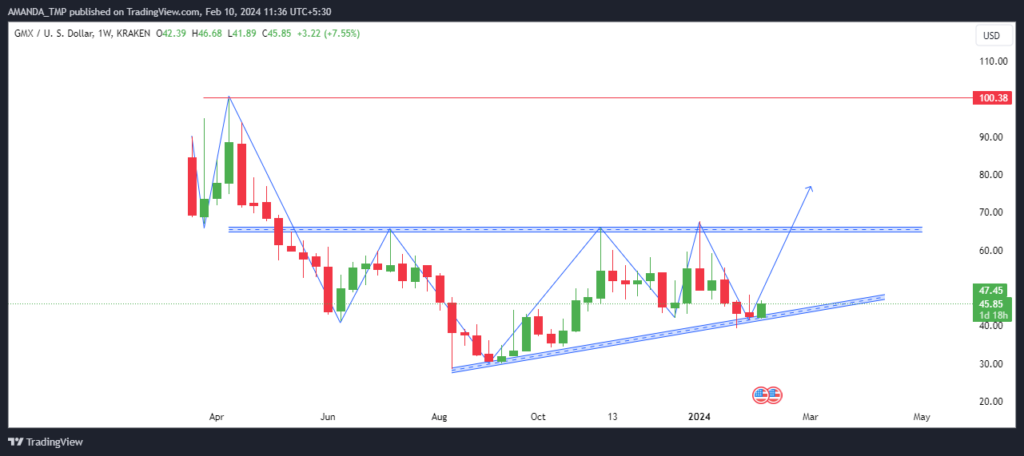
The GMX crypto price is trading inside a dynamic range and is also respecting a dynamic trendline by taking support at it.
Since, the price of the crypto respects respects the trendline, the chances of breaking the price above the crucial swing high of $67.5 are high. Based on the most recent price action, the price of the crypto is forming a bullish candle on the dynamic support.
If the price of the token gets an influx of buyers, a further surge in the crypto price can be witnessed which might lead to a breakout in the price. Also, this breakout might end up attracting more buyers who can push the price to further higher levels.
GMX/USD Chart by TradingView
On lowering the timeframe, the EMAs indicate bearishness on the chart as the price of the GMX token has declined below the 50 and 200-Day EMAs. The EMAs are also trading in a death cross indicating further bearishness.
The MACD indicator shows the signs of the beginning of an uptrend on the daily chart as the MACD and the signal line are trading below the zero level but have formed a bullish cross. The length of histograms on the chart is also advancing.
The RSI seems pretty uncertain as it has recently hit the 50-level but has not broken above it yet. Therefore, one must wait for some more time for the RSI to form a clear pattern.
Summary
GMX price is volatile and has lost value from its peak. GMX price is trading in a range and may break out if buyers come in. Technical indicators are mixed and show uncertainty.
Disclaimer
This article is for informational purposes only and does not provide any financial, investment, or other advice. The author or any people mentioned in this article are not responsible for any financial loss that may occur from investing in or trading. Please do your research before making any financial decisions.


