

- The supply inflation of the Decentraland crypto is medium.
- The trading price of the MANA is up 4996% from its all-time low price.
Decentraland is a virtual world on Ethereum where users can buy land, create content, and monetize their experiences. It is owned and governed by the community, using MANA tokens as the native currency. Decentraland was launched in 2017 by Meilich and Ordano, and opened to the public in 2020.
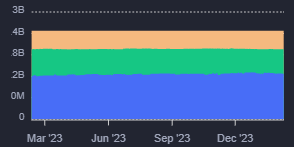
The Decentraland crypto has a circulating supply of 1.893 Billion MANA and the total supply of the crypto is 2.193 Billion MANA which results in a fully diluted market cap of $1.030 Billion. Moreover, the maximum supply of the crypto is not disclosed.


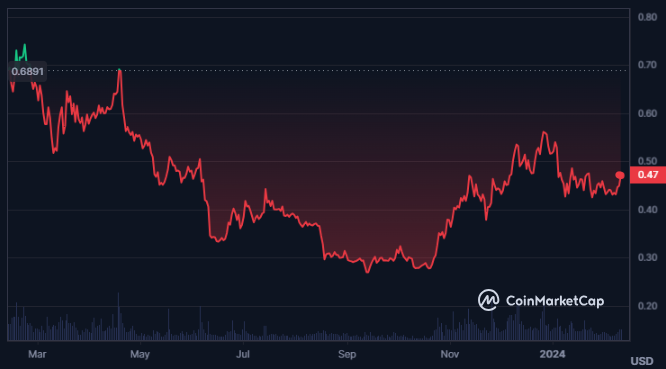
The market cap of the crypto has witnessed an advance of 3.19% in the last 24 hours which has led to a market cap value of $889.285 Million. This makes the Decentraland the 76th largest cryptocurrency in the global crypto market.
The trading volume of the crypto has also witnessed a surge of 30% with the advance in the market cap. This has resulted in a value of $77.917 Million of traded volume in the last 24 hours.
Also, the crypto has a medium volatility of 2.05%, considered medium and the sentiment of the crypto is also bullish as per CoinCodex. The fear and greed index is at 74 indicating greed among investors.
Decentraland Crypto Holdings Analytics

The following charts show the whale holdings pattern and the addresses by holdings. As per the data provided by CoinMarketCap, it can be seen that 50.94% of the crypto is held by the whales, and the remaining 49.06% by other retailers and investors.
Moreover, there are 2.32% of traders in the MANA crypto and 67.59% holders followed by 30.08% of cruisers.
MANA Crypto Technical Analysis
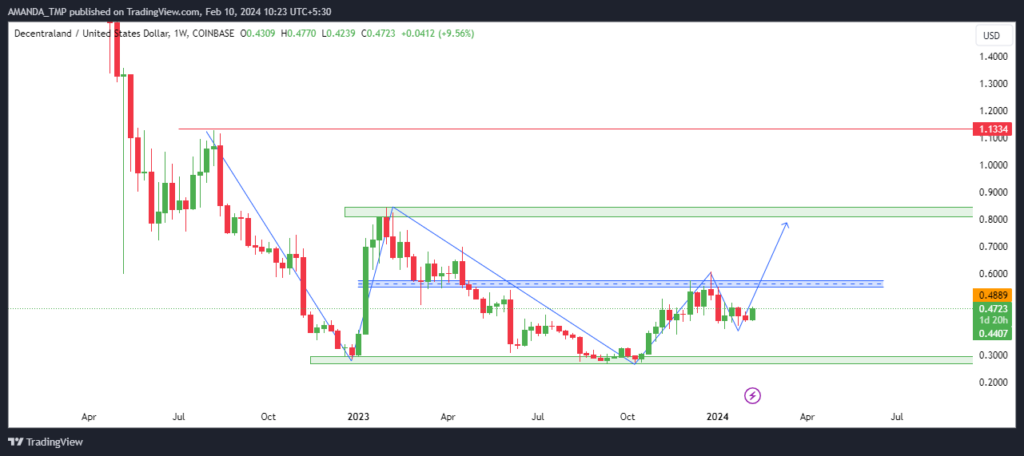
The MANA crypto price is leading to the formation of a higher high structure and has formed bullish candlestick patterns on the weekly chart. The crypto price has also formed a most recent swing high of $0.6100.
For further advance in price and continuation in the uptrend, the price of the crypto will need to break above the most recent swing high. After the breakout, the first target can be expected for the level of $0.8500 as the next resistance for the crypto lies at the same level.
MANA/USD Chart by TradingView
The 50 and the 200-Day EMAs are trading in a golden cross while the price of the crypto fell below the EMAs and has now rebounded above the levels.
The following behavior of the EMA structure shows that the price of the crypto has completed a deep retracement in price and now is free to advance to a higher level.
The MACD indicator is showing bullish behavior on the daily chart as the distance between the MACD and the signal is increasing followed by a bullish crossover. It also has formed bullish histograms on the chart.
The RSI is following a golden cross and has broken above the 50-level after sustaining below the same for a long time. The RSI further broke above the 14-day SMA and is consistently leading to higher levels.
The following behavior of the technical indicators show a possibility of further advance in the crypto price in the future.
Summary
MANA is a crypto token that powers Decentraland, a virtual world where users can create and monetize their own content. MANA has shown impressive growth in price, volume, and market cap, as well as bullish technical indicators. Thus, if the price of the crypto breaks above the last swing high, further advances in the price might be seen.
Disclaimer
This article is for informational purposes only and does not provide any financial, investment, or other advice. The author or any people mentioned in this article are not responsible for any financial loss that may occur from investing in or trading. Please do your research before making any financial decisions.


