

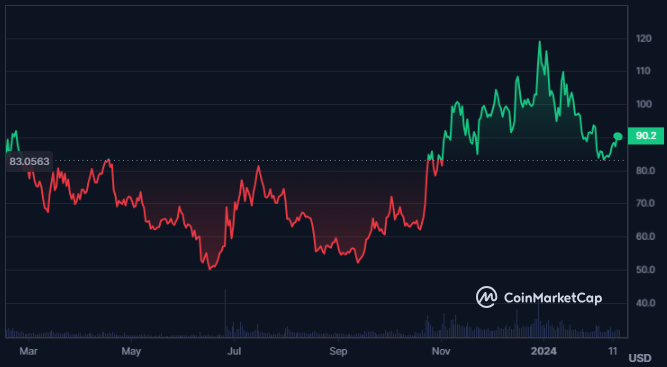
- AAVE crypto price has advanced by 245% from its all-time low.
- The sentiment of the crypto is bearish as per Coincodex.
Aave (AAVE) operates on Ethereum and the Aave protocol, facilitating borrowing, lending, and yield generation in DeFi. Users can access flash loans and stake AAVE for rewards. AAVE replaced LEND in 2020, introducing enhanced features and governance.
AAVE crypto price has advanced by 0.3% in the last 24 hours and is currently trading at a level of $90.31. Moreover, the market cap of the crypto is $1.330 Billion and it is the 57th largest cryptocurrency in the global crypto market as per CoinMarketCap.


The trading volume of the crypto also did not witness any significant activity over the last 24 hours as it has witnessed a small advance of 0.65%. Also, the value of the traded volume for the crypto is $119.195 Million.
The market cap/TVL ratio for the crypto is 0.1703 and the Total Value Locked for the crypto is $7.783 Billion. Also, the circulating supply of the crypto is 14.732 Million AAVE and the total supply of the crypto is 16.0 Million AAVE.
Also, the fully diluted market cap of the crypto is $1.442 Billion and the supply inflation of the crypto is medium resulting in 4.54%. The market cap dominance of the crypto is 0.07% and the fear and greed index of the crypto is at 74 indicating greed.
AAVE Crypto Derivatives Analysis
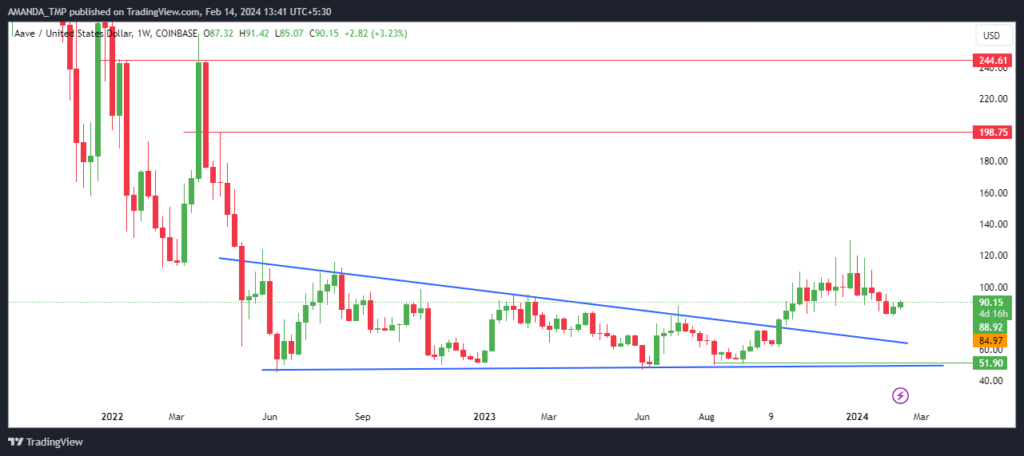
The trading price of the AAVE/USD has formed a descending triangle pattern on the weekly chart and the trading price of the crypto has further broken the pattern.
Also, $130.00 has been established as resistance level. If the price of the crypto further breaks above the last swing high, further rise in the crytpo price will be witnessed.
AAVE/USD Chart by TradingView
The crypto price is facing resistance at the 50-level as the price of the crypto is trading between the 200-day EMA and the 50-day EMA. If the price further manages to break above the 50-day EMA, a further surge in the price can be seen.
The MACD and the signal line are trading in a golden cross and are forming bullish histograms on the chart. The following behavior of the indicator represents the buyer dominance in the crypto price.
The RSI on the daily chart of the AAVE crypto is advancing towards the higher level and has hit the 50 level. It also has advanced above the 14-Day SMA suggesting a buy signal.
Summary
Despite a bearish sentiment, AAVE crypto has surged by 245% from its all-time low, trading at $90.31. While trading volume remains stable, AAVE formed a bullish breakout from a descending triangle pattern. The MACD and RSI indicators signal buyer dominance, hinting at further advancement in price.
Disclaimer
This article is for informational purposes only and does not provide any financial, investment, or other advice. The author or any people mentioned in this article are not responsible for any financial loss that may occur from investing in or trading. Please do your research before making any financial decisions.


