

- The Terra Classic crypto has very high volatility resulting in 9.02%.
- From its all-time high price, LUNC dropped around 99%.
LUNC, formerly Luna, is Terra Classic’s native staking asset, stemming from Terra’s rebranding due to a depegging incident. It secures the PoS network, engages in governance, and acts as collateral for stablecoins. Created amidst Terra community influence, it adapts alongside Terra’s quest for stablecoin-backed financial infrastructure.
With a market cap dominance of 0.03%, Terra Classic is the 99th largest cryptocurrency in the global crypto market. Also, the current market cap of the Terra Classic token is $669.373 Million.


The trading volume of the crypto further declined by 21.8% and the value of the traded volume of the token was $35.656 Million in the last 24 hours. Also, the volume/market cap ratio of the token is 5.17%.
The supply inflation is relatively low resulting in -3.56% and the sentiment of the crypto is bearish. Also, the fear and index of the token shows that investors are greedy in the crypto.
Also, the circulating supply of the token is 5.78T LUNC and the total supply of the crypto is 6.808 Trillion. Furthermore, the max supply of the token is infinite and the fully diluted market cap of the Terra Classic token is $788.334 Million.
Terra Classic Token Derivatives Analysis
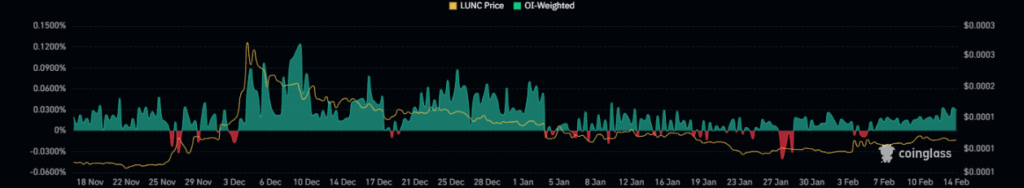
The long/short ratio of the token is 0.8713 and the derivatives trading volume has declined by 15.4% in the last 24 hours. Also, the value of the traded volume for the crypto is $28.87 Million.
The open interest of the crypto has further declined by 3.7% and the short liquidation of the crypto is $11.15K against heavy long liquidations of $70.89K. The following data shows bears in power followed by the last 24 hours.
LUNC Crypto Technical Analysis
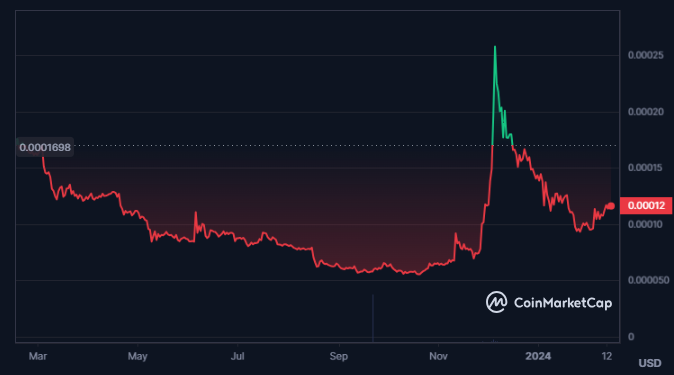
The LUNC crypto price witnessed a sudden surge in the trading price few months ago, following which, the price made a swing high of $0.000279. The price of the crypto further witnessed a selling pressure from the following level and lost more than 60% of its value.
The following behavior of the crypto price shows seller dominance and weak sentient in the LUNC crypto.
LUNC/USD Chart by TradingView
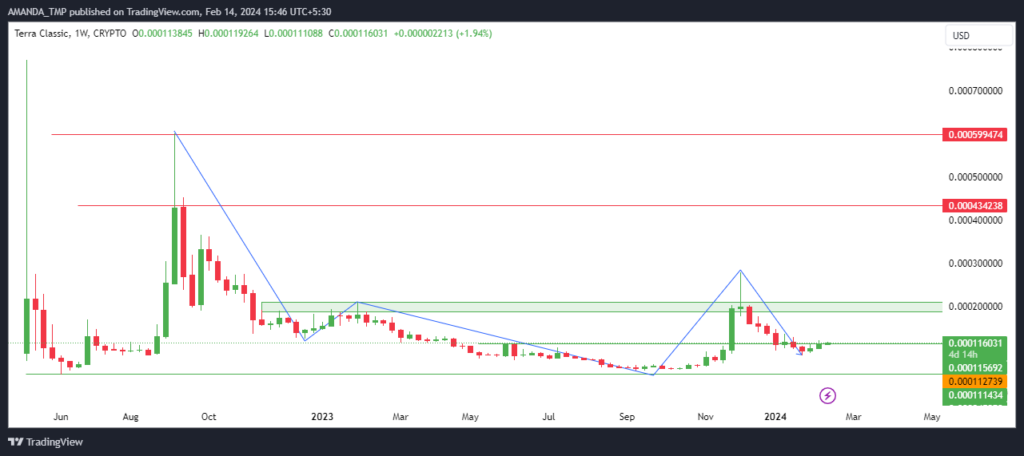
The 50 and the 200-Day EMAs are trading in a golden cross and the price of the LUNC crypto has advanced above the following EMAs. The following behavior of the EMAs indicates the possibility of further advanced in the crypto price.
The MACD line recently broke above the zero level and the signal line is following the same and advancing to the zero level. The histograms are also bullish on the chart of the crypto.
The RSI is also consistently rising to the higher levels and is currently trading at 54.13, advancing above the 14-Day SMA. The following behavior of the indicators represent the possibility of an advancement in the crypto price in the short term.
Summary
Despite LUNC’s 99% loss from its all-time high, the chart shows high volatility at 9.02%. The trading volume and sentiment are bearish, technical indicators signal a potential short-term bullish trend. EMAs formed a golden cross, MACD shows bullish momentum, and RSI indicates upward movement.
Disclaimer
This article is for informational purposes only and does not provide any financial, investment, or other advice. The author or any people mentioned in this article are not responsible for any financial loss that may occur from investing in or trading. Please do your research before making any financial decisions.


