

- HBAR price has given a breakout from the $0.08048 resistance level.
- HBAR/USD has formed a bullish flag pattern at the $0.06752 support level.
Launched in September 2019, Hedera (HBAR/USD) is a decentralized sustainable, enterprise-grade public network. It introduces a distributed ledger technology known as Hashgraph, unlike other cryptocurrency platforms. It uses a novel form of (PoS) Which allows HBAR users to stake their resources to help protect the network.
Previous Price Actions and the Important Levels of Hedera
On January 2023, the HBAR price surged nearly 181% from the $0.03500 major support level. Consequently, that rally made a major change in character to the $0.09891 resistance which intrigued the crypto investors to take long positions.


The HBAR price made a bullish correction at $0.05461 and failed to move above the $0.07767 important resistance level. Later, that resulted in a fall of 48% to the $0.04007 important demand level. Afterward, it formed a W pattern and broke above it.
As a result, the price reached a new higher high at the $0.10881, which is a major resistance level. HBAR price is looking for a bullish correction, it reacted from the $0.06752 decisional demand zone.
Moreover, the HBAR may reach the $0.13760 resistance level, if it manages to break above the $0.10881 major resistance level. However, the price is currently moving 82.56% below its all-time high level.
Technical Analysis of the HBAR/USD
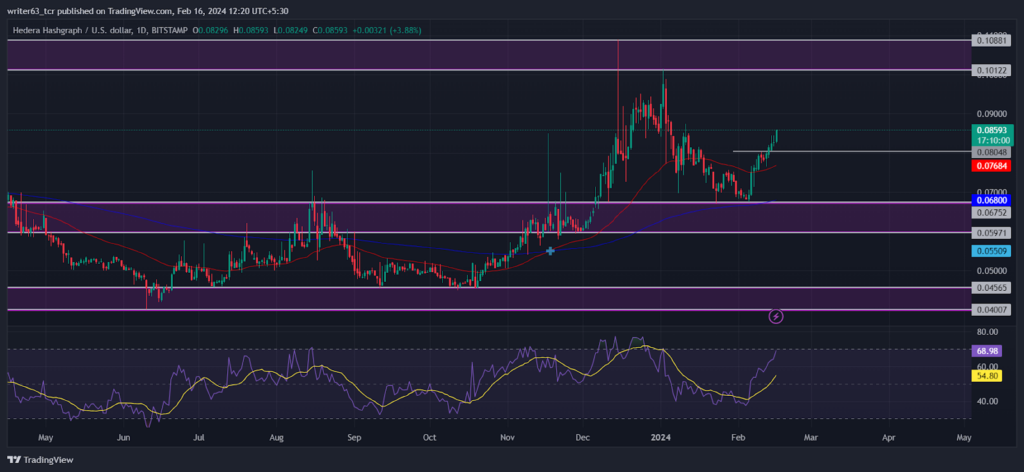
The HBAR price is crossed above the 50-day EMA at $0.07653 after taking support from the 200-day EMA at $0.06735 showing positive indications. Previously, the 50-day EMA and the 200-day EMA had a bullish crossover at $0.05509. That crossover may prevent the price from falling shortly.
From the $0.04565 support level, the HBAR/USD price surged more than 130% to the $0.10881 resistance. Subsequently, it formed a bullish flag pattern at the $0.06752 support level. It received some positive reactions from the $0.06752 decisional demand zone.
The price has given a breakout from the $0.08048 initial resistance level. And it is making its way to the $0.10881 major resistance. The other resistance and support are $0.13760 and $0.04007.
Furthermore, the relative strength index (RSI) is showing positive movements in the current trading session. That reflects a positive signal from the 40-mark. The RSI is sloping above the signal line at 53.26.
Conclusion
The HBAR price has started a bullish rally from the $0.04565 demand zone. That level may play an important role in preventing the price from falling. At press time, the price had broken above the $0.08048 resistance level after taking support from $0.06752. Additionally, it may be seen rising above the $0.10881 major resistance level.
Technical Levels
- Resistance Levels: $0.10881 and $0.13760
- Support Levels: $0.05971 and $0.04565
Disclaimer
The views and opinions stated by the author, or any people named in this article, are for informational purposes only. They do not establish financial, investment, or any other advice. Investing in or trading crypto assets comes with the risk of financial loss.


