- The DOT coin price has delivered a positive return of 5.31% during the weekly trading session.
- The technical indicators summary suggests buy signals.
Polkadot (DOT) is designed to provide a foundation for a decentralized internet of blockchains by connecting and securing the network. The protocol is an open-source and sharded multichain which allows blockchains to be interoperable with each other. It can improve scalability by processing many transactions on several chains in parallel.
DOT Coin Price Got a Massive Response at $3.579
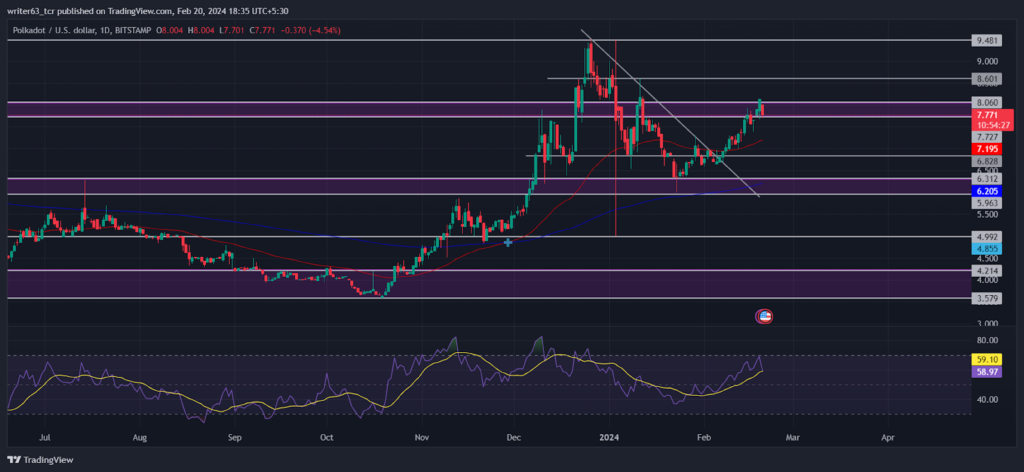
The bearish rally of the DOT coin price ended in October 2023. Afterward, the price suddenly experienced a strong buying from the $3.579 support level and surged 63%. This became enough indication for crypto investors to take trades.
The DOT coin price created a short-term low at the 4.992 support level. Again it advances 60% to the $7.727 resistance level while breaking the $6.312 resistance. The buyers took this as a change of character in the price behavior.
Subsequently, the price made a bullish correction on the $6.312 resistance level and made a new high of $9.481. Many buyers closed their active positions on that particular level which resulted in a quick bearish spike to the $4.992 support level.
However, the DOT coin price got a massive response from that level and it is maintaining the bullish sentiments in the current price. The last 24-hour trading volume has increased by 50.73% indicating buying pressure at the current session.
Technical Analysis of the DOT Coin Price

Recently the DOT COIN price has given a positive reaction from the bullish crossover point of the 50-Day and the 200-Day EMA. The 200-Day EMA is currently playing a major role in preventing the price from falling. The EMAs are moving at the $7.192 and $6.204 levels.
The DOT coin price broke above the trendline forming below at the $6.828 level. Afterward, it got a 20% upward move to the $8.060 resistance level. The price is facing resistance from the short-term high resistance of $8.601.
In the last four trading sessions, the DOT coin price formed a bullish rejection candle reflecting the buyers’ initial positions. As far as the price action is concerned, it may soon give a breakout from the $8.060 level and will reach the $9.48 resistance.
Furthermore, the relative strength index (RSI) shows an internal bullish divergence in the DOT coin price momentum indicating bullish sentiments. The RSI is sloping at 57.16 from the overbought region.
Conclusion
The DOT coin price is performing in an uptrend supported by the 50-day and the 200-day EMAs. Recently, the price has given a breakout from a trendline forming below. It is moving toward the $9.481 resistance. However, the DOT coin price first needs to give a breakout from the short-term high level of $8.601.
Technical Levels
- Resistance Levels: $8.601 and $9.481
- Support Levels: $5.963 and $4.992
Disclaimer
The views and opinions stated by the author, or any people named in this article, are for informational purposes only. They do not establish financial, investment, or other advice. Investing in or trading stocks comes with a risk of financial loss.


