

- The AVAX coin’s market capitalization is $14.05 Billion, and its 24-hour trading volume is $493.63 Million.
- Avalanche crypto’s price stays between 20-day and 50-day EMA and has dropped by 14.62% in a week.
Avalanche (AVAX) price has been bullish since November, surging by 337% to register a 52-week high of $49.96 on December 24, 2024. The bullish trend was disturbed near the $50 hurdle and further performed negatively.
As per the technical chart, the AVAX price continuously faces resistance from the $44 level, and it has recently faced resistance by forming a shooting star candlestick and has dropped by 14% in a week.


For the last week of January, the AVAX crypto price has performed negatively, but it took support on the 100-day moving average and jumped by 49% to approach the resistance level of $44.
The RSI is at 47, continuously declining and heading for the oversold zone. AVAX coin’s price is trading over the significant moving averages but has slipped below the 20-day moving average.
The current market price of Avalanche is $37.19, which has declined by 1.12% in the last 24 hours. The circulating supply is 377,155,371 AVAX, and the fully diluted market cap is $26.77 billion. The total supply of Avalanche is 435,845,011 AVAX, and the maximum supply is 720,000,000 AVAX.
The Avalanche Crypto Price Has Formed a Double-top Pattern on the Daily Timeframe
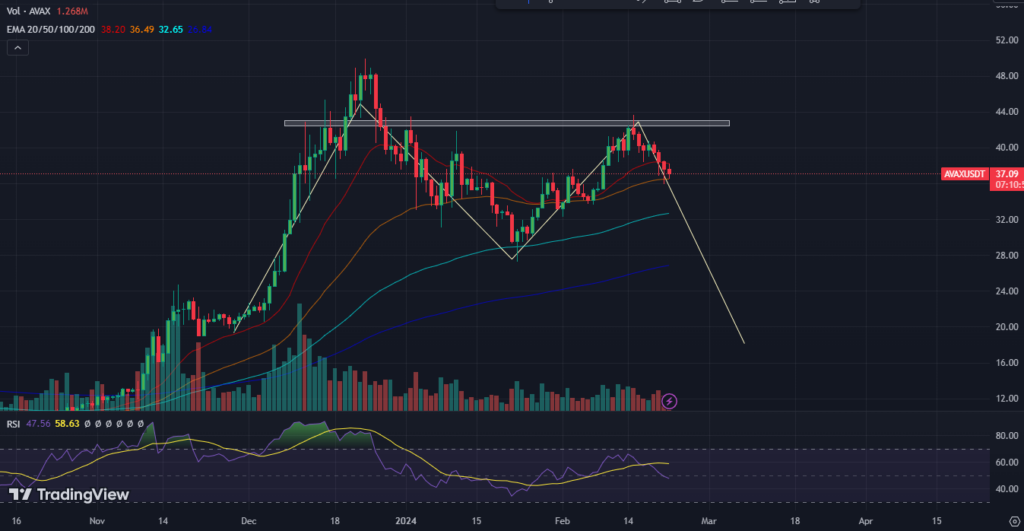
On a daily time frame, the AVAX crypto price has formed a double-top pattern. It has faced resistance from the $44 level a week ago, which has led to a 14% fall. The AVAX price is currently struggling near the 20-day and 50-day moving average.
If the AVAX price slips below the 50-day moving average, it may easily approach the 100-day EMA. But if the Avalanche price fails to defend the 100-day moving average, the sellers may become active and drag down the price to the 200-day EMA.
On the other hand, if the Avalanche price takes support on the 50-day moving average and surpasses the 20-day moving average, a buying momentum can be observed, and the price may rise to the resistance level of $44.
Technical Analysis of the Avalanche Price Over 4-H Timeframe
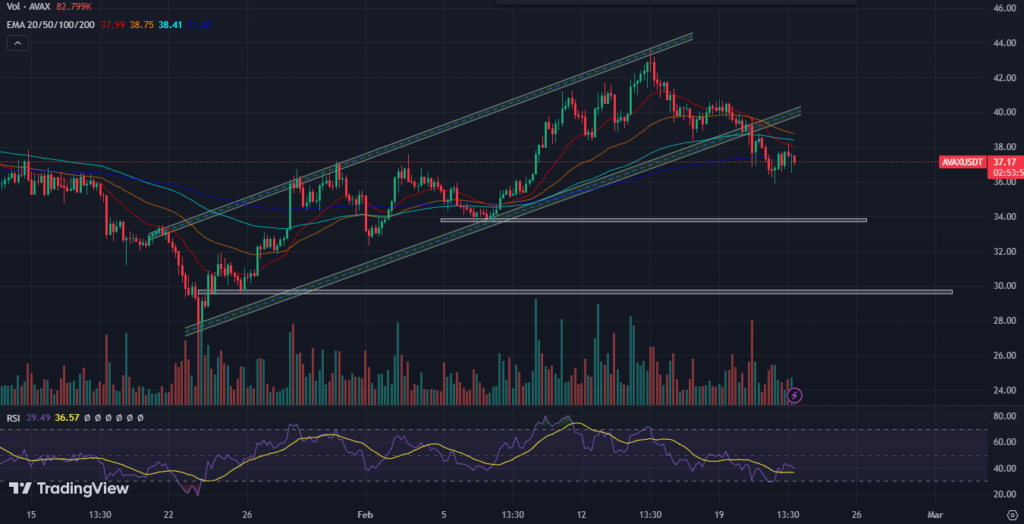
On a 4-H time frame, the Avalanche price has been rising through an inclining channel, recently slipping below the channel. As we can see, the price has sustained below the moving average and is ready for the selloff.
Most sellers will get trapped if the buyers lift the price back to the channel. That may lead to strong buying pressure for a short time. However, aggressive selling can occur, and the price may fall to the $30 mark if it melts below the $36 level.
Conclusion
Based on the technical analysis, the Avalanche (AVAX) price currently faces resistance near the $44 level and has formed a double-top pattern on the daily timeframe. The price has dropped by 14% in the last week and is struggling near the 20-day and 50-day moving averages. If the price slips below the 50-day moving average, it may approach the 100-day moving average. The sellers may become active and drag down the price to the 200-day EMA if it fails to defend the 100-day moving average.
Technical Levels
Resistance: $43.00 & $49.00
Support: $34.00 & $30.00
Disclaimer
This article is for informational purposes only and provides no financial, investment, or other advice. The author or any people mentioned in this article are not responsible for any financial loss that may occur from investing in or trading. Please do your research before making any financial decisions.


