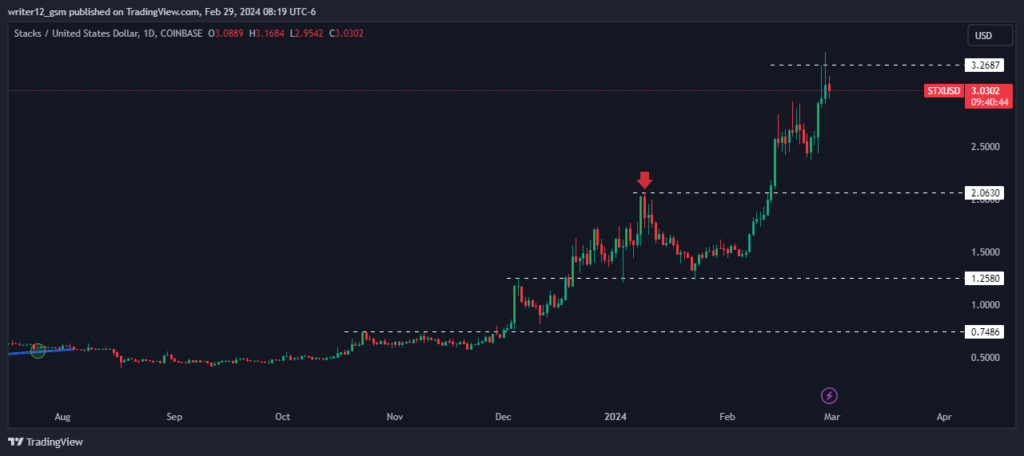
- Stacks crypto price is trading in the bullish zone heading in the upward direction by making a higher high structure.
- STX price is trading above key moving averages showcasing bullishness.
Stacks (STX), a cryptocurrency that enables smart contracts on the Bitcoin blockchain, has outperformed the broader market by skyrocketing more than 93.52% over the past month, reaching a high of $3.00.
This surge in the token’s adoption, growth rate, and positioning as a Bitcoin layer for smart contracts can be attributed to the recent surge in Bitcoin’s price. Over the past week, the value of Stacks cryptocurrency increased by approximately 12.88%. This upward trend has been sustained over the past month, with an overall increase of around 95.44%.
Looking back over a three-month period, STX has experienced an increase of about 333.23%, while over the last six months, the incline has been around 540.98%. The crypto has performed exceptionally well this year, with an impressive year-to-date increase of approximately 100.43%.
As of the time of writing, the price of Stacks crypto was $3.0395, with a slight intraday loss of 1.53%, indicating a mild bearish sentiment. The trading volume is $628.05 Million, and the market cap is $4.34 Billion. Analysts have maintained a strong buy rating for this cryptocurrency.
Technical Analysis of StacksCrypto Price in 1-D Timeframe

STX has been steadily rising for the past three months, gaining 337.13%. As of now, STX crypto is attempting to maintain this level after a pullback.
If it can hold on to this level, the price of Stacks could continue to rise and reach its first and second targets of $4.00 and $5.00 respectively. However, if the STX price fails to maintain this level and decreases, it may hit the nearest support levels of $2.00 and $1.600.
At the time of publishing, Stacks crypto (USD: STX) is trading above the 50 and 200-Day SMAs (Simple moving averages), which are supporting the price trend. The current value of RSI is 76.67 points. The 14 SMA is above the median line at 76.27 points which indicates that the Stacks crypto is bearish.
The MACD line at 0.3079 and the signal line at 0.2785 are above the zero line. A bullish crossover is observed in the MACD indicator which signals more bullishness for the STX crypto price.
Summary
Stacks (USD: STX) technical oscillators and indicators support the bullish trend. The MACD, RSI, and EMAs are highlighting positive indications and suggest that the postive trend may continue in the STX crypto price.
Technical Levels
Support Levels: $2.00 and $1.600
Resistance Levels: $4.00 and $5.00
Disclaimer
This article is for informational purposes only and does not provide any financial, investment, or other advice. The author or any people mentioned in this article are not responsible for any financial loss that may occur from investing in or trading. Please do your own research before making any financial decisions.


