

- A bullish crossover has been generated between the RSI and RSI-based moving averages.
- The trading volume of Arbitrum has surged by 112% in the past 24 hours.
According to the technical data, the trading volume of Arbitrum (ARB) crypto has jumped by 112% in the last 24 hours, and according to the trading volume, it ranks 23rd in the cryptocurrency market. In a broader time frame, the ARB crypto price has been in a bullish trend and has risen by 115% since November.
The Arbitrum token price recorded an all-time high of $2.42 on January 11, 2024. Since it has achieved an all-time high, the price has been performing negatively, and the price is unable to reach the last swing high.


The ARB crypto price has been falling by facing resistance from a declining trendline and rising by taking support on an inclining trendline. It has squeezed now and is ready for a breakout.
The current market price of Arbitrum is $1.99, up by 5.22% in the last 24 hours. The market capitalization of Arbitrum is $2.54 billion, and the fully diluted market cap is $19.77 billion. The circulating supply of Arbitrum is 1,275,000,000 ARB, and the total supply is 10,000,000,000 ARB.
The ARB Price Has Formed a Symmetrical Triangle on Daily Timeframe
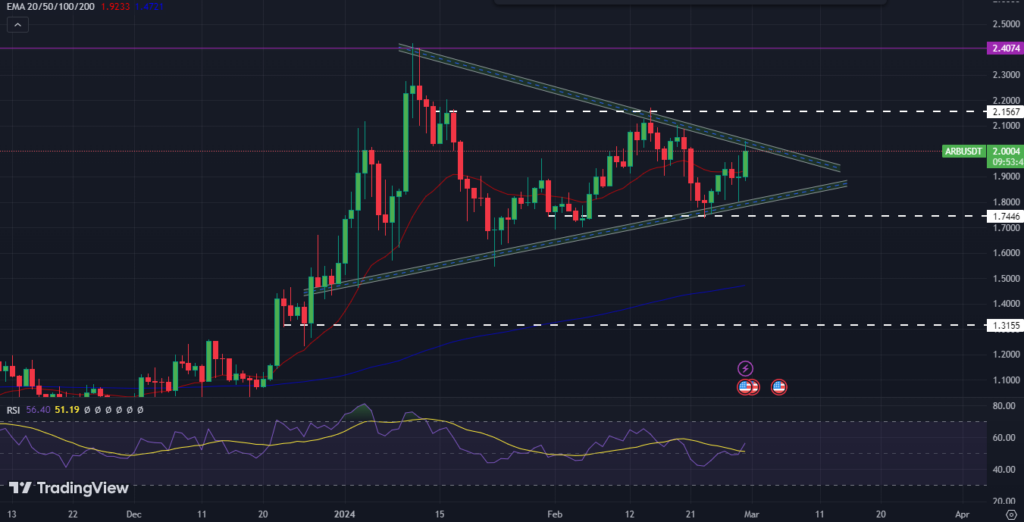
Arbitrum token price has formed a symmetrical triangle on a daily time frame. Buyers can be attracted if the price surpasses the upper trendline and sustains, which may result in buying pressure.
If the buyers manage to lift the price to the $2.20 mark, then it may easily register a new all-time high, and a bullish momentum for the long term can be expected.
Alternatively, suppose the ARB crypto price slips below the symmetrical triangle and fails to defend the $1.70 level. In that case, sellers will become confident and drag the price down to the 200-day moving average.
However, if the Arbitrum crypto price drops below the 200-day moving average, intense selling pressure can be seen because most of the investors will prefer to book profit, and a bearish trend for the long term can be initiated.
Technical Analysis of the Arbitrum Token on 4-H Timeframe
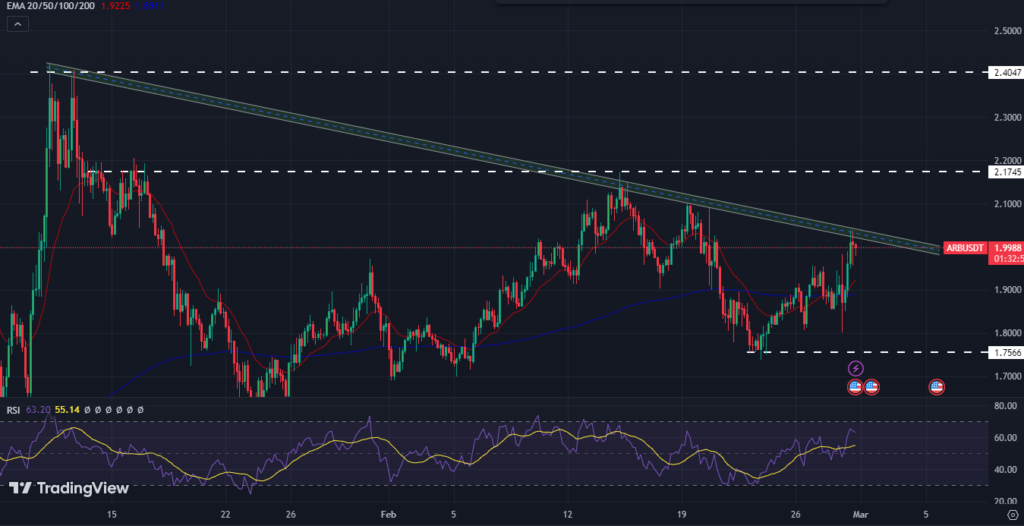
In a 4-H time frame, the ARB crypto price has been in a bearish trend and continuously declining by facing resistance from a declining trendline. Per the technical chart, the Arbitrum price has risen to the trendline and formed a negative candlestick.
Buying pressure can be initiated if the price surpasses the trendline and sustains, and buyers may lift the price to an all-time high. On the other hand, if the price fails to sustain the trendline, it may easily melt to the 200-day moving average. But as per the chart structure, if the Arbitrum crypto price fails to defend the 200-day EMA, strong selling pressure for the next few days can be seen.
Conclusion
Based on the technical analysis of Arbitrum (ARB) crypto, it seems that the price is currently in a symmetrical triangle pattern on the daily timeframe. If the price manages to break out of the upper trendline and sustain above it, we may see a new all-time high and a bullish momentum for the long term. However, if the price breaks below the symmetrical triangle and fails to defend the $1.70 level, we may see a bearish trend for the long term. Therefore, investors should closely monitor the price movements and act accordingly.
Technical Levels
Resistance: $2.20 & $2.40
Support: $1.80 & $1.60
Disclaimer
This article is for informational purposes only and provides no financial, investment, or other advice. The author or any people mentioned in this article are not responsible for any financial loss that may occur from investing in or trading. Please do your research before making any financial decisions.


