

- The graph’s upward trend and the price’s surge last week indicate a spike in TVL.
- The ETC crypto asset exhibits strong upward momentum and bullish tendency as it thrusts above major 20, and 50-day EMA bands.
The Ethereum classic displays that the TVL was at its peak around December 2023 but began to slump afterward. The decline in TVL shows that the demand for projects is losing, and consumers’ willingness to stay invested is decreasing.
Likewise, the TVL is often valued as a vote of confidence in the Ethereum Classic (ETC) protocols. This decrease could cause new users and investors to lose faith in getting involved with the project. This further exhibits that the protocol participants will receive fewer benefits and profits if this continues.


Typically, it is seen that when the TVL of the DeFilama platform surges, liquidity, popularity, and usability also advance, and a decrease in TVL displays the exact opposite, which is less available capital, resulting in lesser returns.
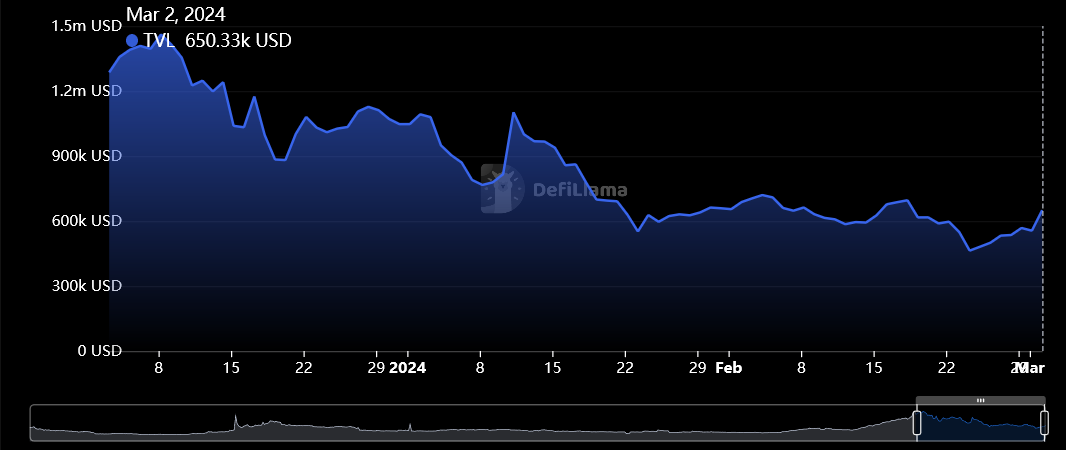
However, the graph’s upward trend and the price’s surge last week indicate a spike in TVL. If the TVL continues to rise, the ETC will also increase. But, if the graph forms lower lows and highs, the TVL could drop, and the price will decline, eroding the user’s confidence.
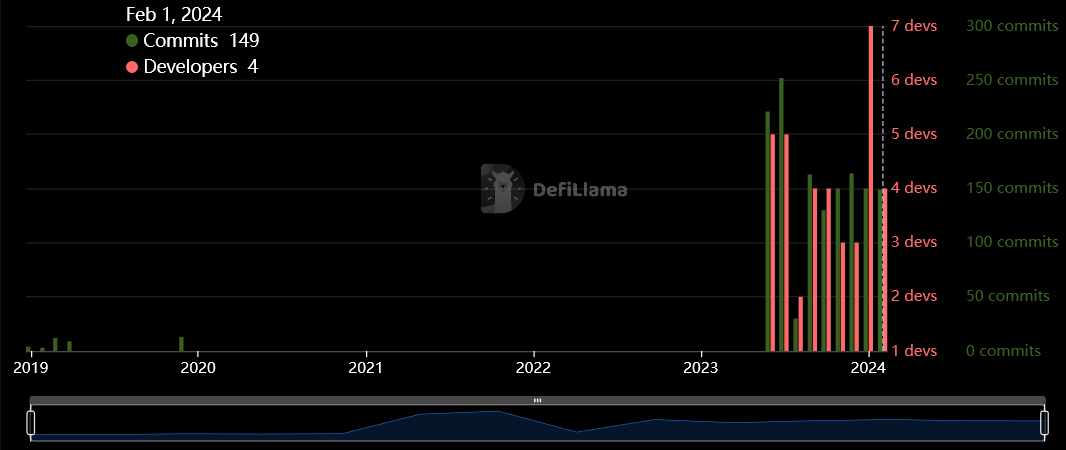
Moreover, the Ethereum Classic displays healthy advancement in its developer activity as commits are changing over time, and the number of core developers has also increased. The core developers and commits have exhibited sustained growth in the span of the last six months, according to Defilama.
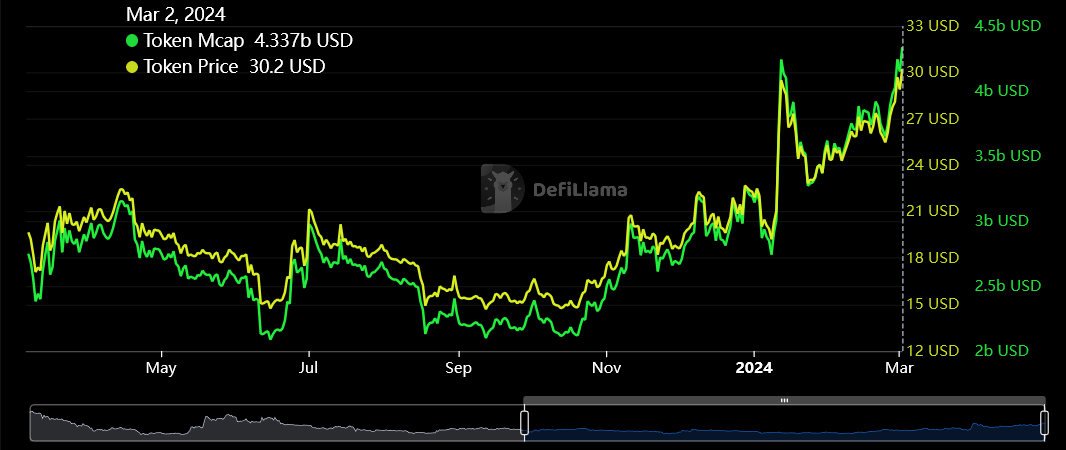
In addition, the market cap exhibits the fluctuations made by selling and buying the Ethereum Classic crypto. The surge and slump in these metrics also illustrate the variability in the coin price over the daily chart. These numbers are shaping the major price structure over the daytime frame chart.
Ethereum Classic Price is Riding the Bullish Wave
The ETC crypto asset exhibits strong upward momentum and bullish tendency as it thrusts above major 20, and 50-day EMA bands; the price action shows that it has breached the supply region and aims to cross it for higher price levels.
Moreover, major reliable indicator tools for the ETC coin illustrate bullish strength as MACD exhibits a bullish cross over the zero line with a broadening histogram. MACD line is at 1.35, the signal line is at 0.84, and the histogram is at 0.51.
The RSI is above 50 at the 75.68 level and has taken giant support from the 14-SMA smoothened line, which is at 60. It implies that the ETC crypto asset is in highly overbought territory and can push further for more upside in the coming sessions after some consolidation in price, which means taking a halt in the ascent.
On examining the day chart, the Ethereum Classic exhibits bullish characteristics and illustrates that it can surge further in the upcoming sessions. At the time of publishing, the crypto is experiencing a massive surge of 8.37% in the last 24 hours, trading at $32.86. The crypto looks enormously ready for more continuation on this huge surge as it has already wrecked through the supply barrier and aims to skyrocket to new levels from the current levels on the daily graph.
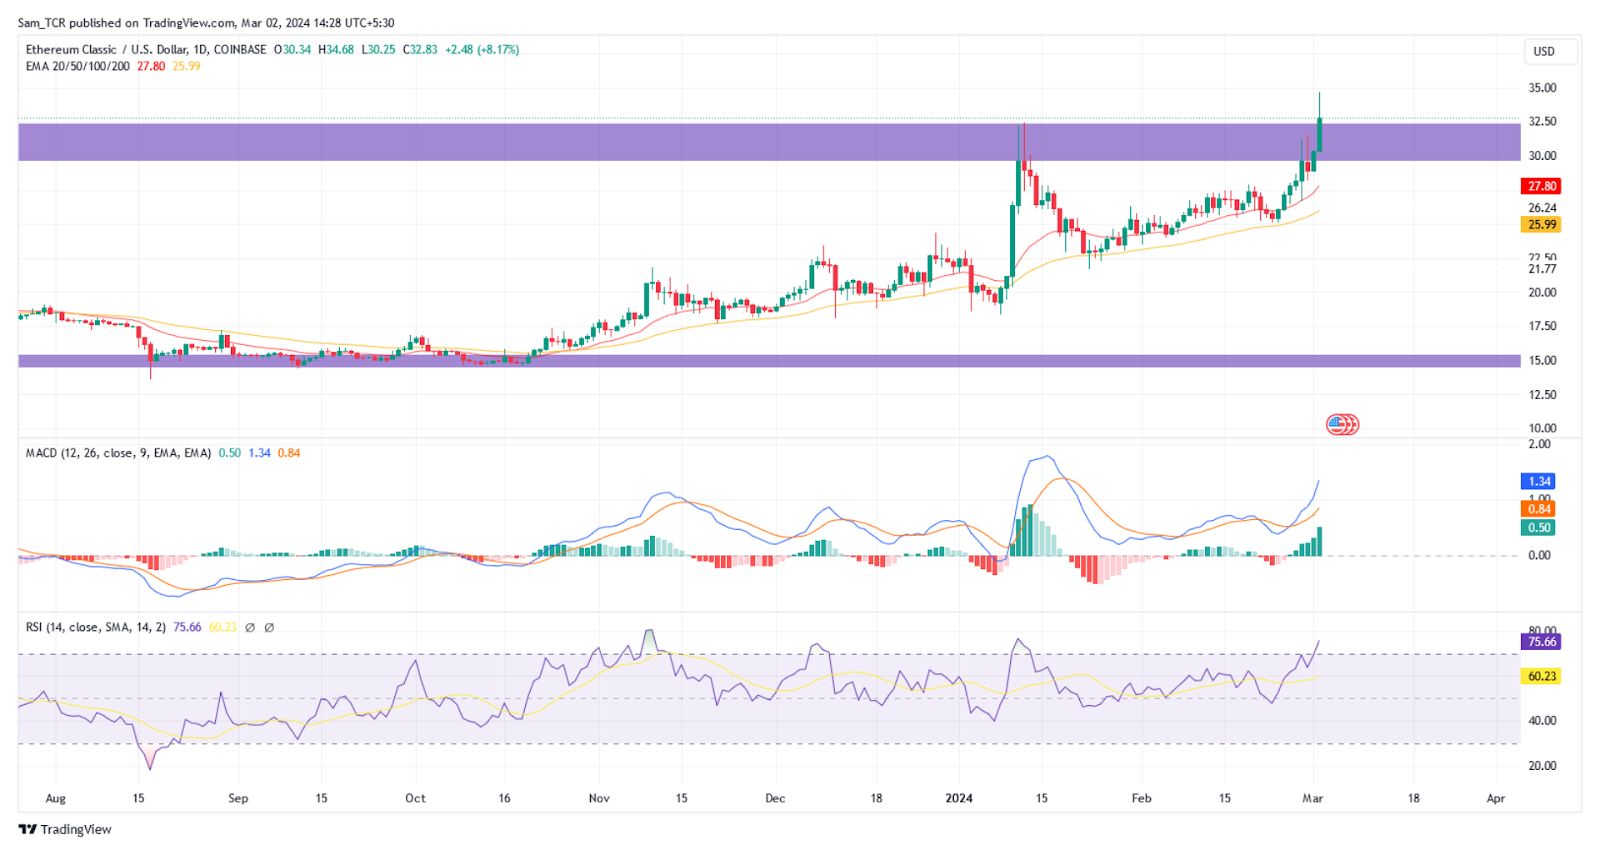
Therefore, if the demand for the ETC remains high, then the next goal for the price could be to reach $40, and in-between primary support would be $35. However, if the crypto price fails to maintain a recent surge and slips past the $28 level, it could decline further.
In addition, the market leaders Bitcoin (BTC) and Ethereum (ETH) experienced a sharp rally, which seems to be stabilizing near the highs after a strong bull run in the current week. The BTC crypto seems to be stabilizing near above $60 K, whereas ETH is trading close to $3500, and whole markets are also resonating with them.
Summary
The Ethereum Classic displays that its commit count and core developers have surged in the past couple of months, and the Market capitalization is increasing, as per the Defilama website. However, the earlier decrease in TVL has been showing sustenance signs as it advanced from last week. Moreover, the price structure displays it has surpassed the supply region and is attempting to break above it to continue its ascent.
Technical Levels
Support Levels: $28
Resistance Levels: $35
Disclaimer
In this article, the views, and opinions stated by the author, or any people named are for informational purposes only, and they don’t establish the investment, financial, or any other advice. Trading or investing in cryptocurrency assets comes with a risk of financial loss.


