

- LINK crypto price is trading far over the significant moving average which showcases the bullish trend.
- Chainlink crypto price is up by 17% in a week and recorded a 52-week high.
- The buyers are keen to lift the price to the $30 mark this month according to the chart structure.
Chainlink price has witnessed a bullish momentum since September 2023 and has risen by 258%. Today, it has recorded a 52-week high of $21.44 and according to the technical chart, the buyers are in control.
From November to January, the LINK price consolidated in a parallel channel but it gave a breakout at the beginning of February and has risen by 22%. Recently, the price has triggered a pullback and risen by 17% in a week.


The current market price of Chainlink is $21.27 which is up by 6.09% in the last 24 hours. The market capitalization is $12.46 Billion and in terms of market cap, it ranks 13th in the cryptocurrency market. The trading volume is $800.43 Million which has increased by 32% in the last 24 hours.
RSI is at 68 and heading for the overbought zone which indicates the bullish strength. The price has recently surpassed the 20-Day moving average and risen by 13% in a few days.
Chainlink Price Prediction on a Daily Timeframe
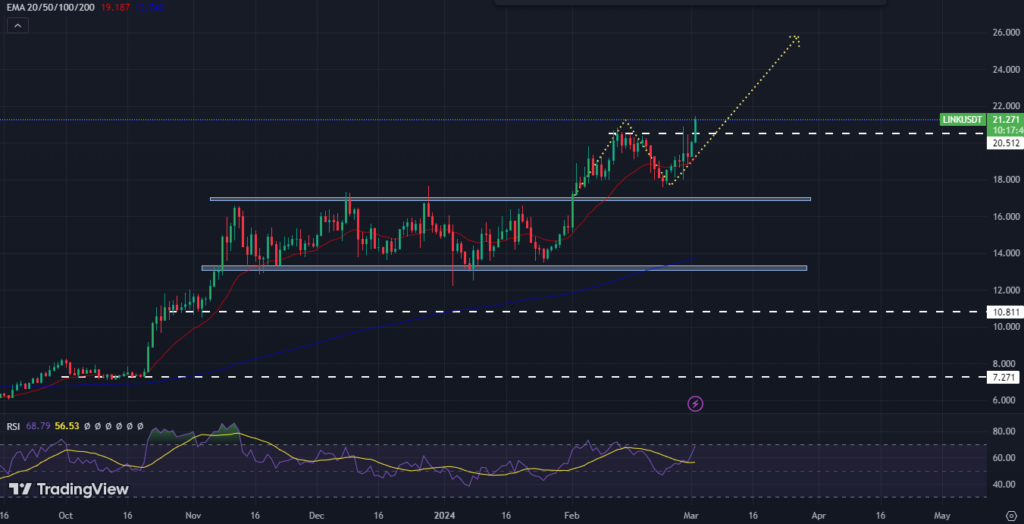
On a daily time frame, the LINK price has triggered a pullback near the $18 mark and it has surpassed the last swing high. Currently, it has approached the 52-Week high and witnessing a sharp rise.
If the buyers remain strong and buying volumes remain stable then the buying momentum can be expected and it may rise to the $30 mark soon. But if the LINK price manages to sustain at the $30 mark and gives a positive breakout, then a trend reversal is likely on the wider time frame.
On the other hand, if the LINK price fails to sustain the last swing high and drops below $18, then it will enter the parallel channel. But if the price slips below the parallel channel and sustains then sellers will become active and drag down the price to the $8 mark and will lose previous gains.
Technical Analysis of Chainlink on 4-H Timeframe
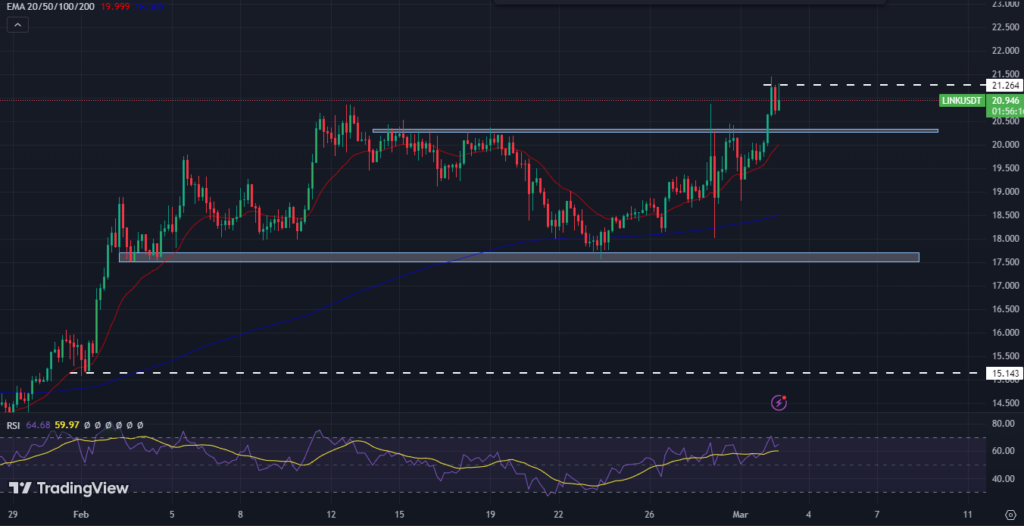
According to the technical chart, the LINK crypto price has surpassed the resistance level of $20.50 with a strong buying candlestick which indicates the buyers’ accumulation.
Recently, it has formed a price rejection candlestick from the $21 mark. If the price drops below the $20 level then profit booking in the short term can be initiated. But if the price fails to defend the $18 mark then sellers may get the control and may lead the trend further.
Alternatively. If the chart structure manages to attract investors then the price will be pumped and a bullish trend for some time can be triggered.
Conclusion
Based on the technical analysis, the Chainlink price is currently in a bullish trend and has recorded a 52-week high. The buyers are keen to lift the price to the $30 mark this month according to the chart structure. However, if the price fails to sustain its current level and drops below $18, it may enter a parallel channel and witness a trend reversal.
Technical Levels
Resistance Levels: $25.50 & $35.00
Support Levels: $18.00 & $16.00
Disclaimer
This article is for informational purposes only and provides no financial, investment, or other advice. The author or any people mentioned in this article are not responsible for any financial loss that may occur from investing in or trading. Please do your research before making any financial decisions.


