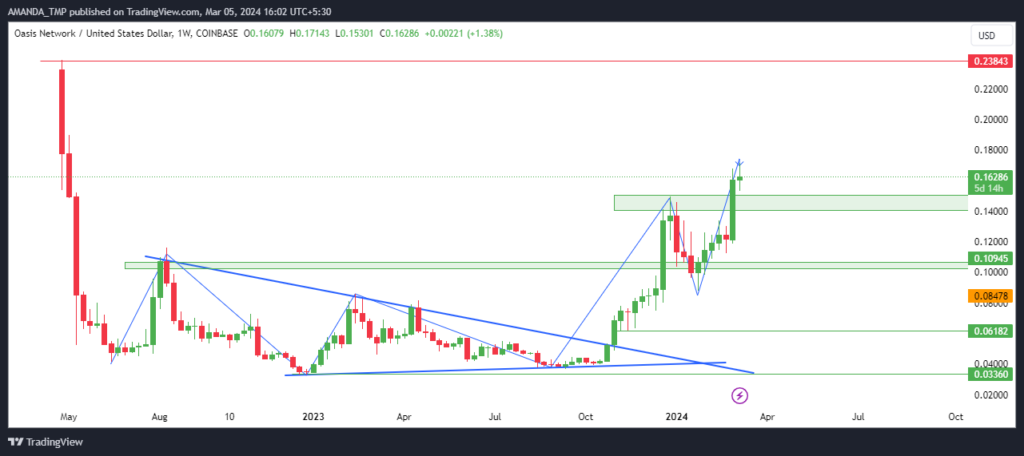
- The Oasis Network trading price has advanced by 400% from its all-time low price.
- The trading volumes of the ROSE crypto is trading flat over the last 24 hours.

Oasis Labs is a privacy-centric blockchain platform developed by UC Berkeley researchers and led by Dawn Song. Launched in 2018, it focuses on building highly scalable, secure, and privacy-preserving decentralized applications (dApps).
The Oasis Network crypto market cap has declined by 3.36% in the last 24 hours and is the 96th largest cryptocurrency in the global crypto market. The total supply of the crypto and the maximum supply are the same, resulting in 10.0B ROSE.
The trading volume of the crypto further witnessed an advance of 13.7% in the last 24 hours, and the value of the traded volume for the crypto is $108.648M. Also, the crypto’s volume/market cap ratio is 10.2%, and the fully diluted market cap is $1.615B.
The volatility of the crypto is also very high, resulting in 11.26%, and the supply inflation of the crypto is also high. Moreover, the market cap dominance of the crypto is 0.04%. The sentiment of the crypto is also bullish, and the fear and greed index is at 90, indicating extreme greed.
The stablecoin market cap of the Oasis Network crypto is $916.4K, following which the Total Value Locked of the crypto is $2.0M.
Oasis Network Derivatives Analysis

The short liquidation for the Oasis Network crypto is very low compared to the long liquidation for the crypto over the last 24 hours. The derivatives trading volume of the crypto has also slightly advanced by 16.6%.
The value of the derivatives trading volume over the last 24 hours is $90.15M, and the open interest further witnessed a decline of 2.52%, which results in $31.75M. Also, the long/short ratio of the crypto is 0.9384.
The following data indicates weakness in the crypto price over the last 24 hours.
ROSE Crypto Technical Analysis

After breaking out above the crucial swing highs, the share price of the ROSE crypto is consistently advancing to higher levels. The following behavior of the crypto has led to the formation of a higher high swing on the charts.
The momentum on the ROSE crypto’s weekly chart looks strong, followed by the formation of strong bullish candles on the weekly chart.
ROSE/USD Chart by TradingView
The EMAs are following a bullish momentum with the consistent advance in the values of the EMA followed by the advance in the price. The 50-day and 200-day EMAs also trade in a golden cross, while the crypto price trades above the EMAs.
The MACD and the signal line are trading in a bullish cross, followed by the formation of bullish histograms on the daily chart of the crypto. The lines on the MACD indicator are also trading above the zero line.
The RSI is also trading above the 14-day SMA, has hit the overbought zone, and is currently trading at a level of 75.11. The following behavior of the RSI indicates a bullish cycle in the crypto price.
Summary
The Oasis Network’s ROSE crypto has surged by 400% from its all-time low, exhibiting bullish momentum. Trading volume rose by 13.7%, supported by a bullish sentiment and extreme greed fear index.
Technical analysis reveals consistent bullish patterns, including golden cross EMAs and MACD bullish crosses, indicating continued upward momentum.
Technical Levels:
- Support levels: $0.0336 and $0.06180
- Resistance levels: $0.23743 and $0.2500
Disclaimer
This article is for informational purposes only and does not provide any financial, investment, or other advice. The author or any people mentioned in this article are not responsible for any financial loss that may occur from investing in or trading. Please do your research before making any financial decisions.


