

- The TIA coin price experienced a fall of 25% for the four consecutive weeks.
- Technical indicators summary suggested a negative signal in the current sessions.
- Celestia’s current market capitalization has decreased by 3.69%.
Celestia (TIA) is a minimal blockchain that decouples execution from consensus by introducing a new primitive, data availability sampling. It is the first modular blockchain network that allows anyone to deploy their blockchain with minimal overhead. Developers can define their own execution and settlement environments in the Celestia network, unlocking new unrealized possibilities for builders and developers.
Celestia Has Witnessed a Massive Return of 500% in the Previous Six Months
The TIA coin price has experienced an upsurge of over 230% from the $2.24 level on November 9, 2023. The price created a resistance level of $7.52 and made a retracement on the $4.99 level, which serves as a trampoline.


Subsequently, the price surged over 200% from the $4.99 support level. It made a decisional point of interest (POI) on the $9.83 level. On January 3, 2024, the TIA coin price got a strong bullish reaction from the $9.83 demand level.
Afterward, the TIA coin price hiked over 100% to the $20.49 resistance level. On the other hand, the buyers were ready for another bullish rally. They placed their positions on the $15.01 demand level and completed their target of the $20.49 resistance.
However, the price has been experiencing a fall since February 10, 2024. The trading volume of TIA coin price has increased by 2.67% in the last 24 hours. Celestia crypto’s current market capitalization is $2.65 Billion, ranked 46th per the coinmarketcap.
Technical Analysis of the TIA Coin Price
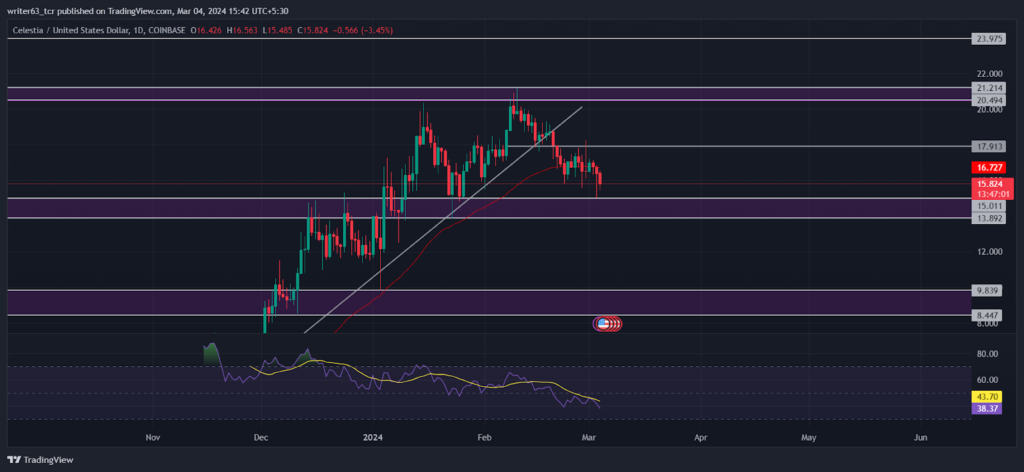
The TIA coin price has recently slipped below the 50-day EMA. It indicates a short-term fall can be seen until it rebounds by the 50-day EMA. The 50-day EMA is moving above the current price at the $16.73 level.
Regarding the price action, the TIA coin’s price has given a breakdown at $17.91 from the trendline forming above. It fell 16% to the $15.01 demand level. In the last two trading sessions, it got a bullish reaction from that level.
The current price is looking for a bullish confirmation on the $15.01 demand level. It may take a bullish reversal if a solid green candle is formed on this level. However, the price can also see a shortfall if it closes below the $13.89 support.
Furthermore, the relative strength index (RSI) reflected a bearish divergence in the price momentum. It could be a false signal if it compares to the spot price chart. The RSI is sloping at 39.44 toward the 30-mark lower band.
Summary
The TIA coin price has given a breakdown from the long-lasting trendline forming above. The current price has gotten a bullish reaction from the $15.01 demand level in the last two trading sessions. However, the price is looking for a bullish confirmation in the form of a solid green candle from the $15.01 level to continue the bullish rally. It can reach the $23.97 level if it closes above the $17.91 breakdown level.
Technical Levels
- Resistance Levels: $17.91 and $21.21
- Support Levels: $13.89 and $9.83
Disclaimer
The views and opinions stated by the author or any people named in this article are for informational purposes only. They do not establish financial, investment, or other advice. Investing in or trading stocks and crypto comes with a risk of financial loss.


