

- The Litecoin crypto has witnessed higher long liquidation over the last 24 hours.
- The price of the LTC crypto advanced by more than 7500% from its all-time low price.
Litecoin (LTC) is a cryptocurrency created by Charlie Lee in 2011, aiming to improve upon Bitcoin’s limitations with faster transaction times and a higher coin cap. It uses scrypt as a proof of work and serves as a digital currency for peer-to-peer transactions and online purchases. Lee, a computer scientist, spearheaded Litecoin’s development.
The total value locked (TCL) for the Litecoin crypto is $4.92 Million and the market cap of the crypto is $6.327 Billion. Also, the market cap of the crypto declined by 5.3% over the last 24 hours, and per the market cap rankings, Litecoin crypto is #20.


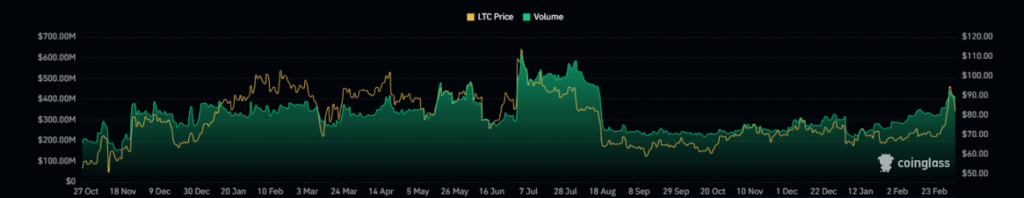
The trading volume of the crypto has advanced by 22.5% despite the decline in the market cap of the ratio over the last 24 hours. Following this, the volume/market cap ratio of the crypto is 19.20% and the market cap dominance of the crypto is 0.25%.
The circulating supply of the Litecoin token is 74.579 Million LTC which is 88.43% of the max supply. Also, the max supply and the total supply of the token are the same and the total supply of the crypto is 84.0 Million LTC.
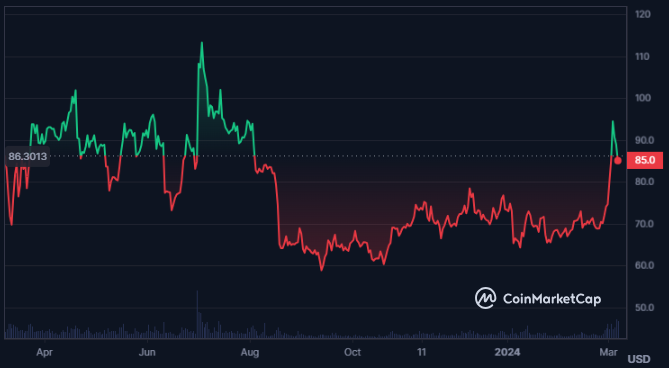
The price of the LTC crypto is currently trading at a level of $85.42 and hit an all-time low price of $1.11 nine years ago. Also, the all-time high price recorded for the crypto is $412.96 achieved three years ago.
Litecoin Token Derivatives Analysis
The long/short ratio of the token is 0.9051 followed by the last 24 hours. Also, the open interest has witnessed a decline of 3.5% resulting in $406.38 Million.
The spot trading volume of the crypto has advanced by 41.7% which has resulted in a traded volume worth $2.07 Billion. Also, the long liquidation for the crypto is worth $8.35 Million and the short liquidation for the crypto is valued at $294.28K over the last 24 hours.
LTC Crypto Technical Analysis
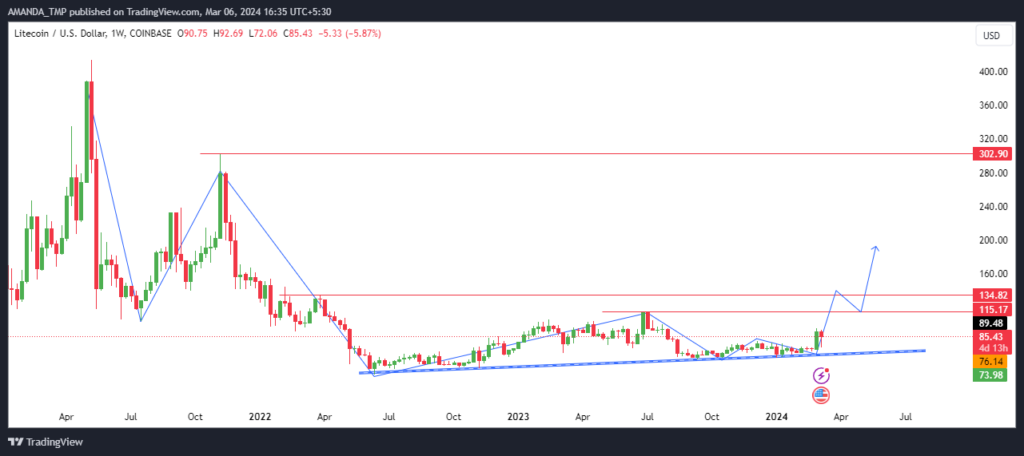
The LTC token price has gained volume followed by a slight advance in the price but the weekly charts show that the price still needs to break above certain levels for confirmation of a bullish trend in the crypto.
At $115, a strong resistance level is situated and if the price of the crypto further breaks above the following level and sustains above the same, further advance in the price might be seen.
LTC/USD Chart by TradingView
On the daily chart of the LTC crypto, the 50 and the 200-Day EMAs have formed a fresh golden cross on the charts recently. Following the crossover, the price of the crypto witnessed a huge surge while the price of the token also retraced back to the EMAs. If the price of the crypto further advances above the last swing high, further continuation in the trend might be witnessed.
The MACD indicator further indicates a bullish signal as the MACD and the signal line are trading above the zero level. Despite this, the histograms are losing their strength and the height of histograms is declining.
The RSI is currently trading at a level of 62.35 and has recently declined below the 14-Day SMA. The following behavior of the RSI indicates strength on the chart and if the RSI again breaks above 14-Day SMA, the price of the crypto might witness a further surge in price.
Summary
Despite LTC’s consolidation, recent technical analysis indicates potential for bullish momentum. The price is nearing key resistance at $115, where a breakout could trigger further upward movement. Golden cross formations on daily charts and bullish MACD signals support this trend. RSI suggests a potential for more surges.
Technical Levels:
- Support Levels: $61.7 and $72.6
- Resistance Levels: $134.00 and $302.00
Disclaimer
This article is for informational purposes only and does not provide any financial, investment, or other advice. The author or any people mentioned in this article are not responsible for any financial loss that may occur from investing in or trading. Please do your research before making any financial decisions.


