

- The inflation rate of the RNDR token is high at 23.5%.
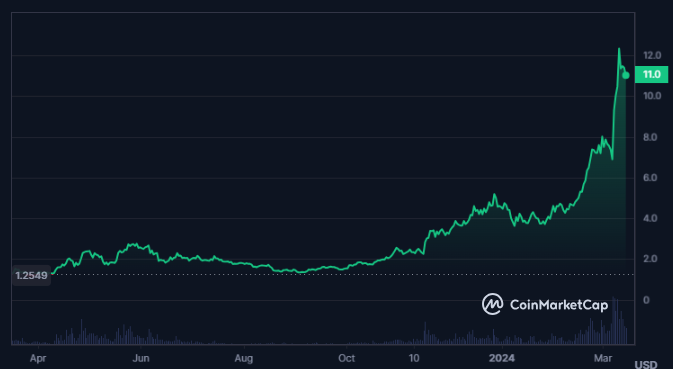
- The price of the Render crypto has advanced by 642% in the last one year.
Render, founded by Jules Urbach in 2016, harnesses blockchain to offer decentralized GPU rendering solutions, with Render Token (RNDR) powering its ecosystem.
RNDR facilitates GPU resource exchange for rendering tasks, acting as both payment and measure of computational work. Acquiring RNDR allows participation as a Node Operator or Creator within Render’s network.


The trading price of the RNDR token has witnessed a massive surge in the last few weeks, which has resulted in a market cap of $4.191B. Also, the Render is the 37th largest cryptocurrency in the global cryptocurrency market.
The trading volume for the Render token has declined by 30.04% in the last 24 hours, which has resulted in a traded value of $300.674M. The volume and the market cap together result in a volume/market cap ratio of 7.21%.
Moreover, the circulating supply of the token is 70.9% of its maximum supply. This results in a circulating supply of 380.642M RNDR, followed by a maximum supply of 536.87M RNDR. Also, the fully diluted crypto’s market cap is $5.917B, per CoinMarketCap.
The all-time high price recorded for the Render crypto price is $12.73, achieved only a few days ago. Moreover, the token price has advanced by 29800% from its all-time low price of $0.03676.
Render Token Derivatives Analysis
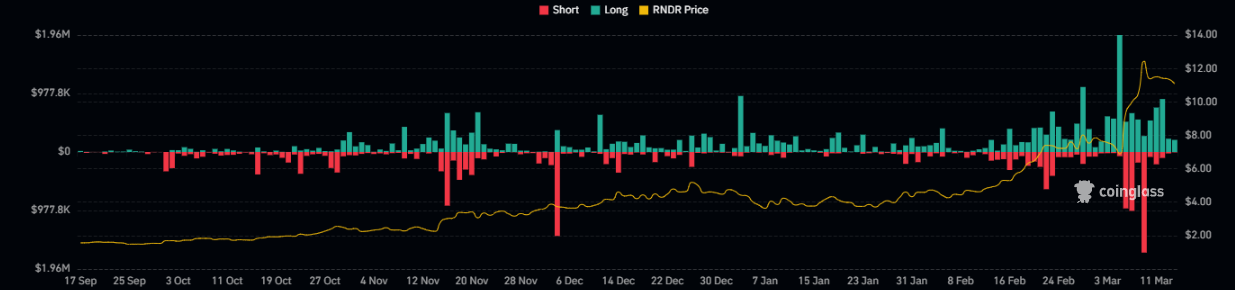
The long/short ratio of the Render crypto is 0.9106, which results in a long liquidation of $317.76K. Despite this, the short liquidation of the token is very low, resulting in $13.79K.
Moreover, the derivatives’ trading volume for the crypto has declined by 37.9% in the last 24 hours. It has resulted in a traded volume of $410.34M. The open interest further decreased by 2.2%.
Weighted Sentiment Vs Price Volatility Of RNDR Token
The weighted sentiment of the token is volatile, indicating a sudden advance and decline over the last few months. It indicates uncertainty, while the crypto’s price volatility has been consistently declining and has hit a low of 0.012 on the Santiment chart.
RNDR Crypto Technical Analysis
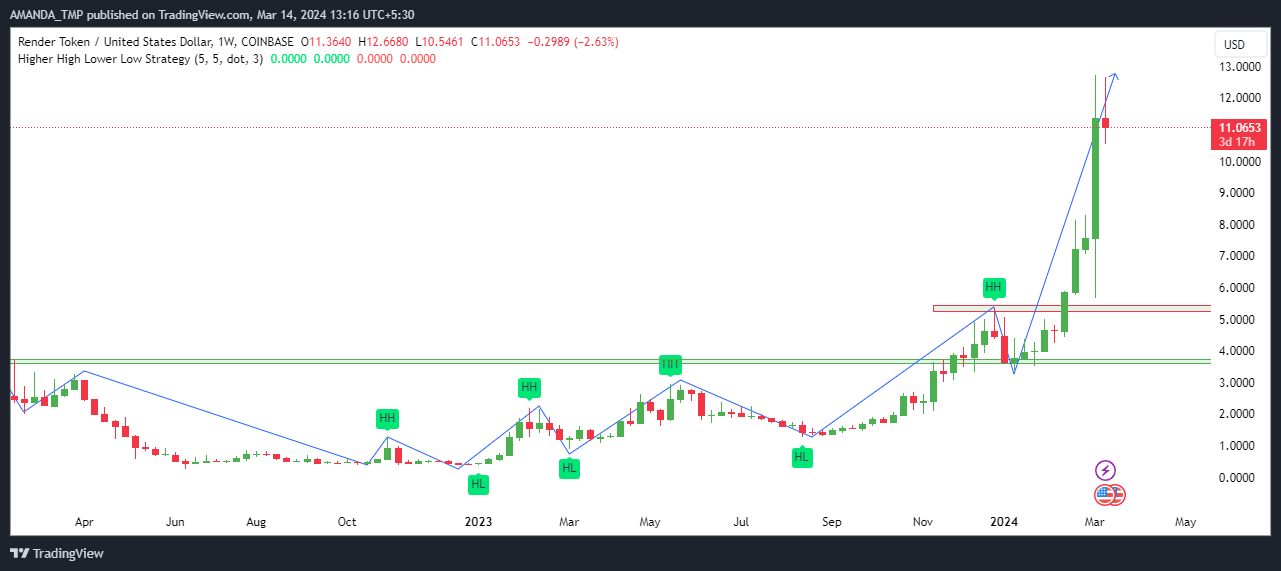
The RNDR token price has been forming higher high swings on the weekly chart and the daily chart. It indicates a strong uptrend in the token’s trading price and has witnessed a huge surge followed by new all-time highs.
RNDR/USDChart by TradingView.com
The 50-day and the 200-day EMAs are trading in a golden cross, followed by the 20-day EMA trading above all the other slower exponential moving averages. It indicates a bullish trend in the Render crypto price.
The Average directional index indicator is trading at a level of 48.38, indicating strength and reliability in the preceding trend of the token price.
The MACD indicator is also exhibiting a positive behavior in the token price of the crypto. It is followed by the MACD line trading above the signal line. Also, both factors are trading above the zero level on the indicator.
Summary
RNDR crypto showcases a bullish trajectory with significant price appreciation, hitting new all-time highs. Despite declining trading volume, its market cap surges to $4.191B, ranking 37th globally.
Technical analysis reveals strong uptrends supported by golden cross formations, bullish EMAs, and robust indicators like ADX and MACD.
Technical Levels:
- Support levels: $3.570 and $5.340
- Resistance levels: $15.00 and $20.00
Disclaimer
This article is for informational purposes only and does not provide any financial, investment, or other advice. The author or any people mentioned in this article are not responsible for any financial loss that may occur from investing in or trading. Please do your research before making any financial decisions.


