

- DOT price is facing resistance from the $11.85 level.
- Technical indicators’ summary suggested neutrality over the current price.
- 24-hour trading volume has declined by 11.90%.
Polkadot (DOT) connects and secures a network of specialized blockchains, facilitating cross-chain transfer of any data. It is an open-source sharded multichain protocol that allows blockchains to be interoperable with each other. The network uses a nominated proof-of-stake (NPoS) mechanism with validators and nominators. Validators are staked on the Relay Chain and confirm transactions from different parachains.
DOT Experienced 136% Growth in the Last Six Months
Polkadot price has been consistently moving in an uptrend since October 2023. However, it made a bullish correction in January 2024 because of the early profit bookings of traders and cruisers. In the last two months, the price surged over 40%.


The fully diluted market capitalization of the Polkadot is at $13.97 Billion. It has a total token supply of 1.42 Billion DOTs, of which 1.29 Billion DOTs are in current circulation. The maximum token supply is unlimited, which makes cryptocurrency an inflationary model.
Allocation for the DOT Tokens
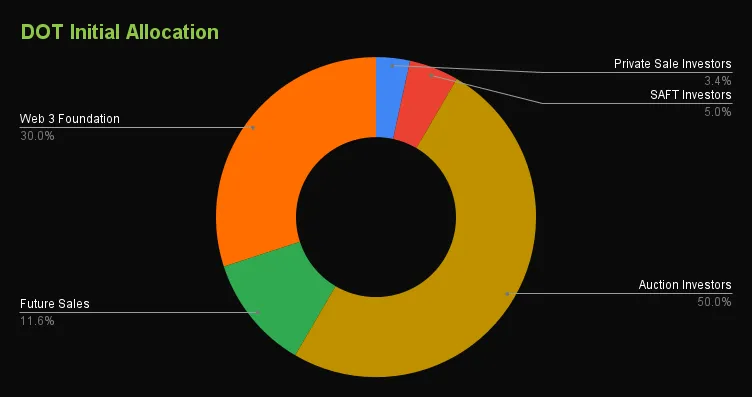
The distribution of initial DOT tokens is as follows:
- 3.42% is allocated to the Private Sale Investors.
- 5.00% is allocated to the SAFT Investors.
- 50.00% is allocated to the Auction Investors.
- 11.58% is allocated to the Future Sales.
- 30.00% is allocated to the Web 3 Foundation.
Price to Volume and Social Dominance Analysis
Polkadot has been socially active to date. The price and volume faced drawbacks in January and February, but social dominance didn’t lose integrity. This reflects the trust of crypto enthusiasts around the world. At present, social dominance is at 0.531%.
The 24-hour trading volume is at $549 Million, which ranked 39th among 9,094 active cryptocurrencies. DOT current market cap is at $12.67 Billion, ranked 10th according to CoinMarketCap. And the all-time high price is at $55.00.
Technical Analysis of the DOT Price
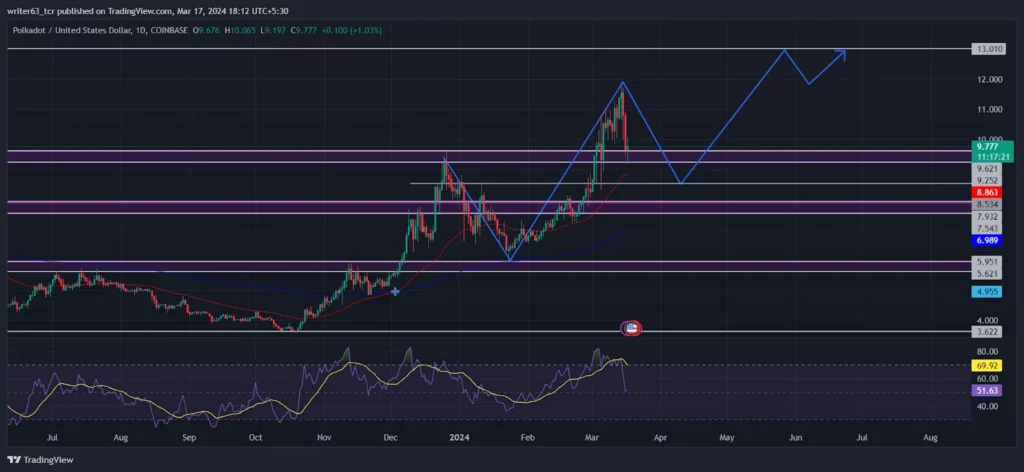
The 50 and the 200-Day EMAs produced a golden crossover at $4.95, reflecting bullish sentiments in the DOT crypto price. The price retraces multiple times on both EMAs, making them dynamic supports.
DOT price has given a breakout from the $9.62 resistance level. It surged 22% to the $11.85 level and faced resistance. The current price is undergoing a correction and could reach $13.00 after retesting the $8.53 decisional point of interest.
The relative strength index (RSI) reflected an internal bearish divergence in the momentum. This indicates the price is facing more substantial selling pressure compared to buying. RSI is sloping at 52.02 from the overbought region.
Summary
The DOT price has been in a bullish trend since October 2023. However, the technical indicators summary suggested neutrality in the current trading phase. The price faced resistance from the $11.85 level and is making a bullish correction. Regarding the technicals, the DOT price can reach $13.00 after a retest of the $8.53 decisional point of interest.
Technical Levels
- Resistance Levels: $11.85 and $13.01
- Support Levels: $9.25 and $7.54
Disclaimer
The views and opinions stated by the author or any people named in this article are for informational purposes only. They do not establish financial, investment, or any other advice. Investing in or trading crypto or stock comes with a risk of financial loss.


