

- PEPE coin price is trading above the 200-day EMA.
- The crypto price has advanced by 25458% from its all-time low price.
Pepe is a meme coin inspired by the internet meme character, aiming to be a token for entertainment rather than financial gain. Launched without presale or taxes, it has no intrinsic value and follows a roadmap for community engagement and entertainment initiatives unrelated to Pepe the Frog creator Matt Furie.

Pepe Coin has a circulating supply of 420.68T PEPE, 100% of its maximum supply. The total supply of the crypto is also the same, followed by a fully diluted market cap of $2.968B.


The trading volume for the crypto has advanced by 16.9% in the last 24 hours, resulting in a traded volume of $982.17M. Also, the Pepe coin is the 43rd largest cryptocurrency in the global cryptocurrency market.
The market cap of the crypto has further declined by 13% in the last 24 hours, resulting in $2.97B. Also, the crypto’s volume/market cap ratio is 32.68%, which results in a very good amount of liquidity, and the market cap dominance of the crypto is 0.12%.
The volatility of the crypto is very high, resulting in 11.47%, and the sentiment of the crypto is bullish as per CoinCodex. The fear and greed index further indicates extreme greed in crypto.
The all-time high price for the Pepe crypto is $0.00000828, recorded on March 14, 2024. The current trading price of the crypto is 34% below the all-time high price.
PEPE Crypto Derivatives Analysis
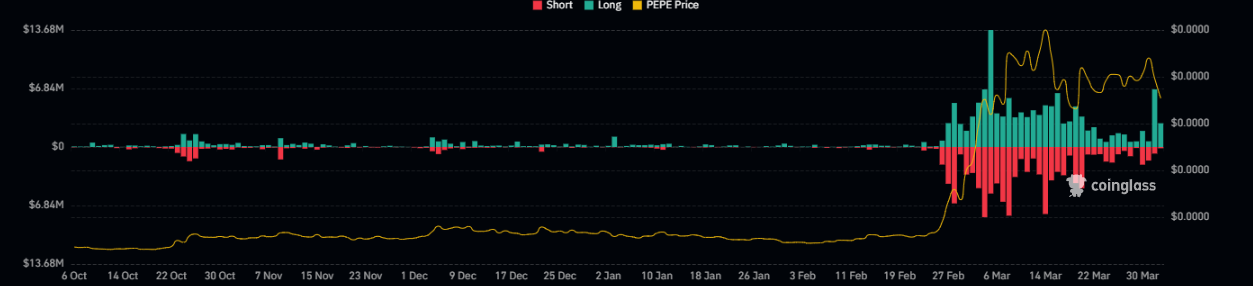
The open interest in crypto has declined by 12.2% in the last 24 hours, resulting in $79.03M. It has witnessed a higher long liquidation worth $3.92M in the previous 24 hours.
The short liquidation recorded for the crypto is $439.76K, and the long/short ratio of the crypto is 0.846. Also, the derivatives trading volume has witnessed a decline of 0.65%, resulting in a traded value of $606.32M.
Price Volatility Vs Weighted Sentiment
The weighted sentiment of the crypto has been static for a long time, while the price volatility of the crypto has been witnessing a decline following the last few days.
PEPE Crypto Technical Analysis
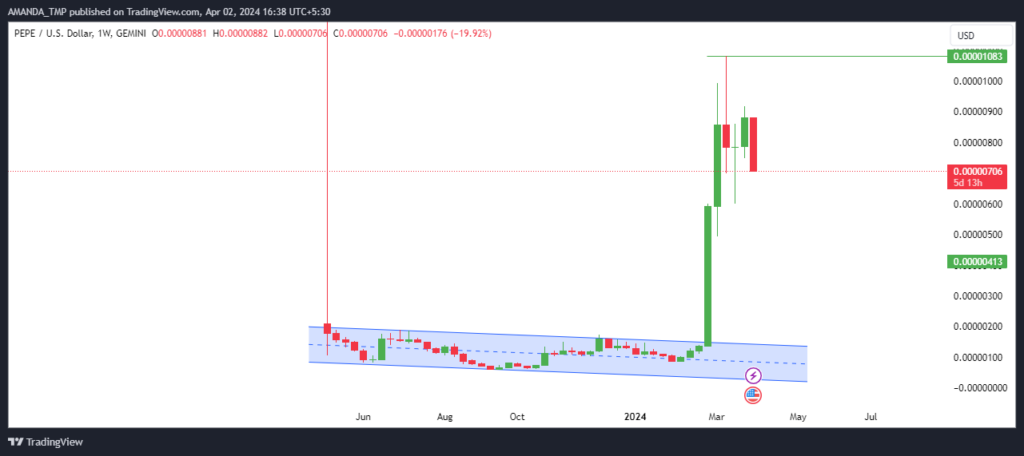
The PEPE crypto witnessed a surge of more than 500% in trading price a few weeks ago. Since then, the price of the crypto has been trading with low volume and is slowly declining to lower levels, indicating the possibility of retracement in the price of the crypto.
PEPE/USD by on TradingView
The EMAs on the daily chart of the PEPE crypto chart exhibit a bullish behavior as the price of the crypto is trading above the 50-day and the 200-day EMA. Despite this, the price of crypto is declining at higher levels.
Thus, if the price of the crypto further takes support at the 50-day EMA and forms a bullish crossover, a further surge in the price might be witnessed.
The MACD and signal line are declining from the higher levels and are trading in a bearish cross. The metrics are further declining towards the zero level. This is further followed by forming the bearish histograms on the chart.
On the daily chart, the RSI has declined below the 14-day SMA, and the RSI has dropped below the 50 level. This further indicates a decline in the momentum of the crypto.
Summary
After a significant surge in price, PEPE crypto experiences a decline in trading volume, signaling potential retracement. Despite bullish sentiment and high liquidity, recent price action suggests uncertainty, with declining sentiment and static price volatility. Technical analysis indicates possible support at the 50-day EMA, but MACD and RSI suggest weakening momentum.
Technical Levels:
- Support levels: $0.00000300 and $0.0000060
- Resistance levels: $0.000010 and $0.0000100
Disclaimer
This article is for informational purposes only and provides no financial, investment, or other advice. The author or any people mentioned in this article are not responsible for any financial loss that may occur from investing in or trading. Please do your research before making any financial decisions.


