- Sandbox crypto price has melted by 14% in the last 2 days.
- SAND price has slipped below the 20-day exponential moving average.
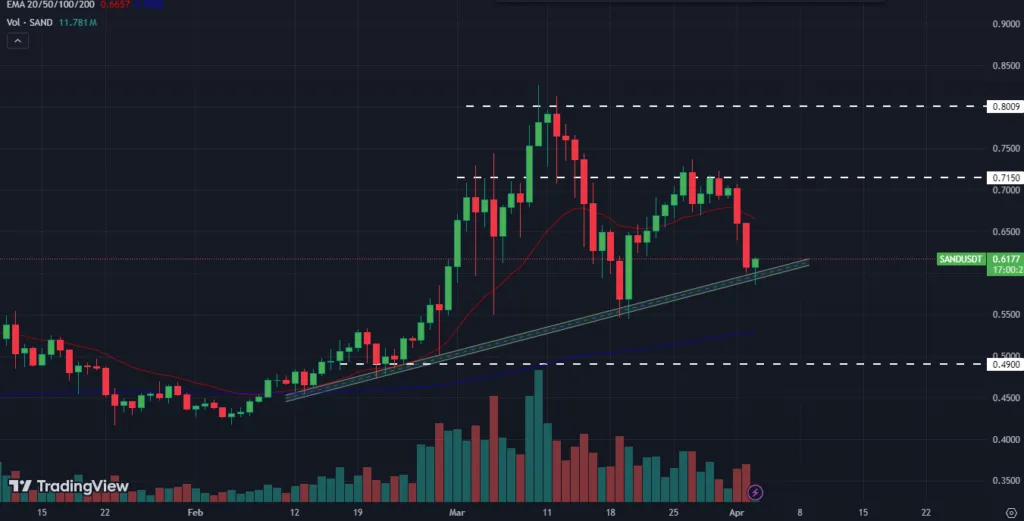
SAND price chart displays the selling pressure on a wider time frame but buyers seem to be strong in the short term. Sandbox price has been bullish but was disturbed near the $0.800 mark and declined by 30% in a week. Recently, SAND faced resistance from the $0.700 mark and performed negatively.
Sandbox (SAND) price has been taking support on the trendline and is now on the trendline. Last time, the SAND crypto price took support on the trendline and bounced back by 25% in a few days. Currently, the Sandbox price has formed a hammer pattern, and if the volume increases, it may gain bullish momentum.
Sandbox price trades at $0.613 with an intraday gain of 1.02%. The market capitalization is $1.38 Billion and the 24-hour trading volume is $144.67 which has dropped by 10%. The circulating supply is 2,251,731,926 SAND and the fully diluted market cap is $1.85 Billion. The maximum and total supply is 3,000,000,000 SAND.
SAND Crypto Volume vs Price Analysis
The graph of volume and price suggests that the trading volume has dropped from $600 Million to $144 Million and the price has witnessed selling pressure. In the last 2 days, the trading volume has increased by 80% but the price has performed negatively and took support on the trendline. According to the trading volume, the Sandbox crypto price may bounce back from the trendline.
Sandbox Crypto Social Dominance & Social Volume Analysis
As per the graph of social dominance and social volume, the awareness about Sandbox crypto on social media has been constant for the last few weeks but the price reacted negatively. If social dominance and social volume increase, then it may affect the price positively.
SAND Crypto Price In A Bullish Trend; Will It Keep Surging?

On a daily time frame, the Sandbox crypto price has been in a bullish trend and rising by taking support on a trendline. Currently, the price has melted back to the trendline and formed a hammer pattern. The price has slipped below the 20-day exponential moving average and witnessed a loss of 14% in the last 2 days.
Suppose the Sandbox crypto price takes support on the trendline and surpasses the 20-day EMA then it may gain bullish momentum for the short term. The trading volume has increased by 80% in the last 2 days which may support the bullish trend.
On the other hand, if the SAND crypto price slips below the trendline and sustains, then sellers may show interest and eye the 200-day exponential moving average. If SAND price fails to defend the 200-day EMA, then investors may prefer to book profit which may lead to a selling pressure over the next few weeks.
According to the technical indicators, the Sandbox price is trading below the 20-day EMA indicating the selling pressure. RSI is at 43 which has dropped below the RSI-based moving average which showcases the bearish forecast.
Conclusion
The SAND crypto price has been volatile in the last few days, experiencing a significant decline and struggling to maintain its position above key support levels. While short-term bullish momentum is possible if the price rebounds from the trendline and surpasses the 20-day EMA, the current indicators suggest a bearish forecast. The trading volume has increased which may support the buying momentum.
Technical Levels
Resistance Levels: $0.7200 & $0.8000
Support Levels: $0.5500 & $0.4900
Disclaimer
This article is for informational purposes only and provides no financial, investment, or other advice. The author or any people mentioned in this article are not responsible for any financial loss that may occur from investing in or trading. Please do your research before making any financial decisions.


