

- Litecoin crypto price has risen by 35% by last month.
- Litecoin price is trading over the significant moving average which indicates the buyers’ dominance.
Litecoin price chart suggests that the price has been in a bullish trend for the last 2 months and gained 52% till now. On a wider time frame, the LTC crypto chart structure displayed that the price has been defending the last swing lows and performing bullishly. Recently, the price has tried to sustain the $110 mark but failed to do so, and currently, it has rebounded to the $110 mark.
The LTC price has extended to the $110 mark and is facing resistance and taking support on the 20-day exponential moving average. Recently, the LTC price has taken support on the $80 mark and rose by 27% in the next 2 weeks.


The current market price of Litecoin is $101.38 which is up by 3.09% in the last 24 hours. The market capitalization is $7.52 billion and according to the market cap, it ranks 19th in the cryptocurrency market. The 24-hour trading volume is $947.17 million which has decreased by 35%.
Litecoin Crypto Volume vs Price Analysis
The graph suggests that the trading volume has been increasing for the last 2 months and the price has witnessed buying momentum. In the last few hours, the trading volume has decreased from $106 million to $89 million. If the trading volume keeps declining then it may affect the price negatively.
Litecoin Crypto Social Dominance and Social Volume Analysis
The awareness and interaction for Litecoin crypto on social media like X, Instagram, and Telegram have increased and the price has also increased. Suppose the social dominance and social volume increase then buyers may lead the trend further.
Technical Analysis of Litecoin Price on 1-D Timeframe
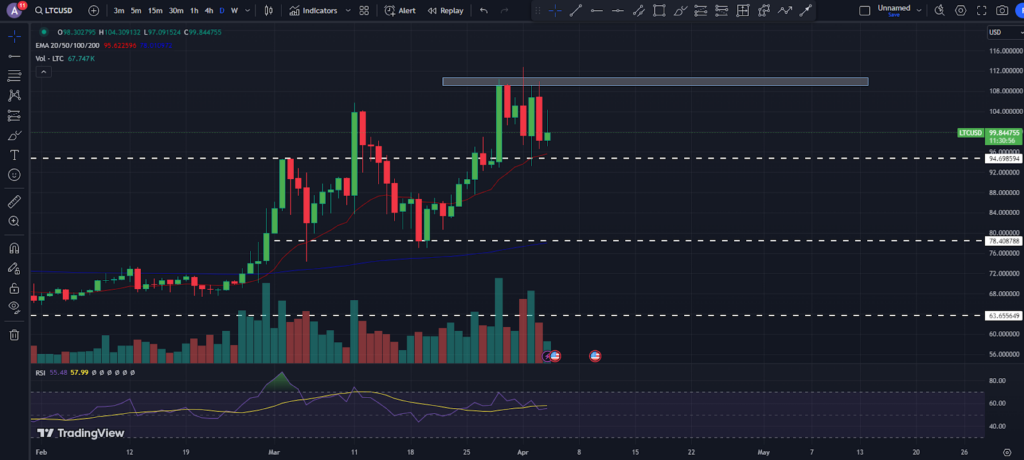
On a daily time frame, the Litecoin price has performed bullishly and reached a multi-day high. Currently, the LTC price is facing resistance from the $110 hurdle. If the price slips below the 20-day exponential moving average then the sellers may drag down the price to the 200-day EMA.
On the other hand, if the LTC price surpasses the $110 hurdle and trading volume increases then the price may gain bullish momentum. Suppose the buyers remain strong then the price may rise by taking pullbacks.
Turning to the technical indicator, the LTC price is trading over the significant moving averages which suggests the buying pressure. RSI is at 55 which has just slipped below the RSI-based moving average indicating the sellers’ grip on the short term.
Litecoin Price Technical Analysis Over 4-H Timeframe
In a 4-H time frame, the Litecoin crypto price has been rising by taking support on the trendline. Currently, the price has formed a strong bullish candlestick of 3..50% on the trendline and the trading volume has been pumped.
Suppose the price manages to sustain over the 20-day exponential moving average then buying momentum for the short term can be expected. However, if the LTC crypto price slips below the trendline then investors may prefer to book profit which may lead to the selling momentum.
Conclusion
Based on the technical analysis of Litecoin price, it seems that the buyers are dominating the market and the price has been in a bullish trend for the last 2 months. Although the price has recently failed to sustain the $110 mark, it rebounded to that level and is facing resistance while taking support on the 20-day exponential moving average. The trading volume has been increasing, and the social dominance and social volume of Litecoin crypto on various social media platforms have also increased, indicating a positive trend.
Technical Levels
Resistance: $110.00 & $115.00
Support: $93.00 & $83.00
Disclaimer
This article is for informational purposes only and provides no financial, investment, or other advice. The author or any people mentioned in this article are not responsible for any financial loss that may occur from investing in or trading. Please do your research before making any financial decisions.


