

- The MONG price has dropped by 23.35% in the last 24 hours.
- MongCoin crypto’s price has declined by 68% in 18 days.
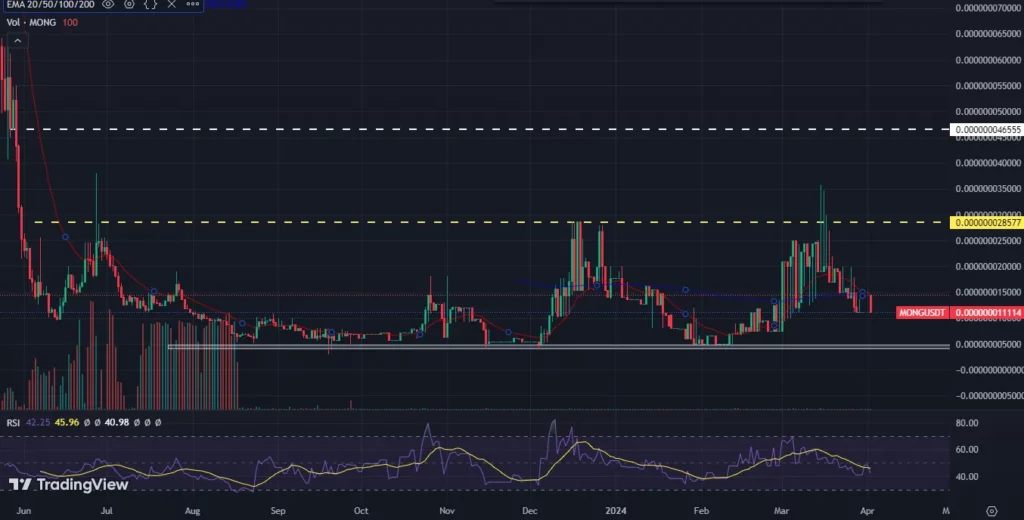
In a broader time frame, the MongCoin price chart has witnessed strong selling pressure and continuously taking support on the $0.00000000500 for the last 7 months. The Mong price has been struggling below the $0.0000000300 for the long term. Recently, the price has faced resistance from the last swing high and declined by approximately 60%.
According to the chart, the Mong crypto price has witnessed selling pressure for the last few days, and recently, it has faced resistance from the 20-day exponential moving average and dropped by 23.35%. Sellers seem to be strong, and the price is heading toward a strong support level of $0.00000000500.


Mong crypto price is trading at $0.0000000111, which has declined by 23.35% in the last 24 hours. The market capitalization is $9.61 million, and the 24-hour trading volume is $2.26 million. The circulating supply is 581.2T MONG, and the total supply is 690T Mong.
MongCoin Crypto Volume vs Price Analysis
According to the graph, the trading volume has decreased from $18 million to $2.25 million in the last 20 days, which has affected the price negatively. Suppose the trading volume increases, the price may perform positively.
MongCoin Crypto Social Dominance and Social Volume Analysis
The graph of social dominance and volume suggests that the awareness of MongCoin crypto has been increasing on social media, but in the last few days, it has decreased. It has affected the price accordingly. Suppose the social dominance and social volume decrease; the MONG price may react negatively.
Technical Analysis of MongCoin on Daily Timeframe
On a daily time frame, the Mong coin price has been struggling between a parallel channel. Recently, the price has faced resistance from the $0.0000000300 mark, witnessed selling pressure, and lost about 60% in the last few days.
The price has slipped below the 20-day exponential moving average and is heading toward the support level. If the MONG crypto price falls and takes support on the $0.00000000500 level and gains bullish momentum, then it may consolidate for some more time in the channel.
Suppose the price fails to defend the $0.00000000500 level; it may record a new all-time high. On the other hand, if the price surpasses the 20-day EMA, it may look for the resistance level of $0.0000000300. If the Mong price starts trading over the $0.0000000300, then buyers may eye for the $0.0000000500 hurdle.
According to the technical indicators, the MONG price is trading below the significant moving average, indicating the seller’s domination. The RSI is at 42, which has retested the RSI-based moving average and is falling, which showcases the bearish trend.
MongCoin Price Prediction on Weekly Timeframe
Based on the weekly time frame, the MONG crypto price has been consolidating for the last few months. Currently, it is facing resistance from the $0.0000000200 level and is falling. If the sellers remain strong, then it may melt to the support level of $0.00000000500.
If the MongCoin price bounces back and surpasses the $0.0000000200 and sustains, buying momentum for the short term can be expected. Suppose the price manages to sustain the $0.0000000200 level; the buyers may look for the $0.0000000500.
Conclusion
In a broader time frame, the MongCoin price has been in a bearish trend and has stuck in a parallel channel. It has been defending the support level of $0.00000000500 for the last few months. According to the analysts, a buying signal can be generated over the $0.0000000200 level, and sellers are in grip between the channel.
Technical Levels
Resistance: $0.0000000200 & $0.0000000500
Support: $0.0000000100 & $0.00000000500
Disclaimer
This article is for informational purposes only and provides no financial, investment, or other advice. The author or any people mentioned in this article are not responsible for any financial loss that may occur from investing in or trading. Please do your research before making any financial decisions.


